
Sometimes it’s very difficult to anticipate the type of questions you should be asking your respondents, that’s why it’s always a good idea to include an open-ended question in your survey.
You’d be surprised at the level of insight a generic comment question might be able to give you. But what happens when it comes time to analyse responses from a free-text question?
Most of us will perceive this as a rather daunting experience. There’s nothing to be afraid of when it comes to this analysis, especially when Culture Counts is here to help!
Here’s a quick 9-step guide to performing your own comments analysis. You can decide to have a generic breakdown of comments by positive, neutral and negative, or dive deep into the analysis with sub-categories (Step 4). Are you up for the challenge? Let’s get started!
Step 1
Download your data.
You’ll need to download your CSV file and open it in Microsoft Excel (or another spreadsheet program). I’d also recommend creating a copy of the comments column in a new sheet to have them separate from the rest of the data.
Step 2
Read through a couple of responses to get an overall feeling of the comments.
You can usually do this by having a quick skim through the first 10-15 comments.
Step 3
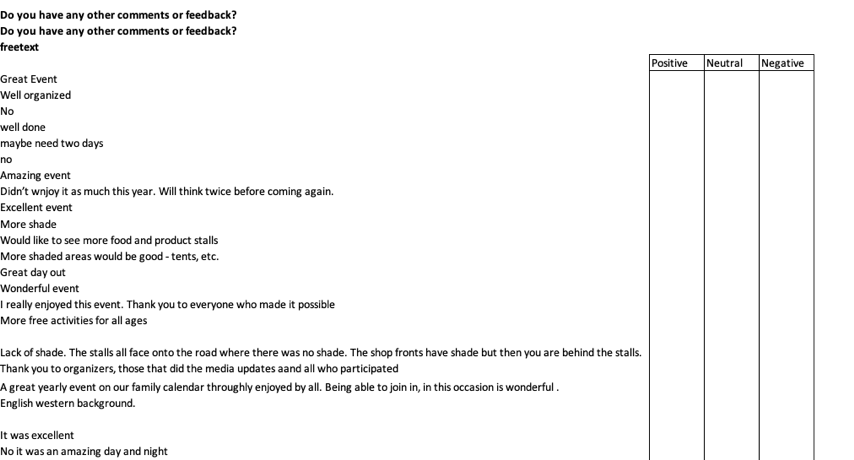
Sort comments into simple categories.
An example for categories includes positive, neutral, negative.
Step 4
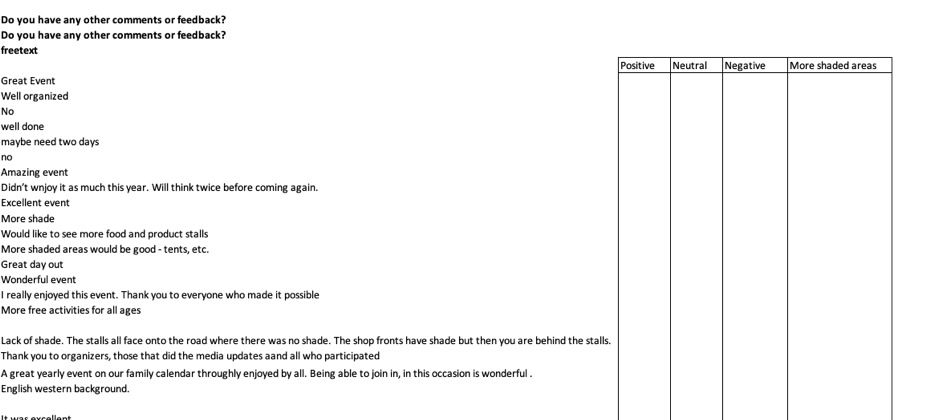
Create sub-categories underneath your general ones to provide even richer detail.
You’ll start to notice some recurring themes. A common example is the one we can see below where a respondent has been complaining about the lack of shade. Put that down as its own category and see whether there are any other comments which mention the same problem.
Step 5
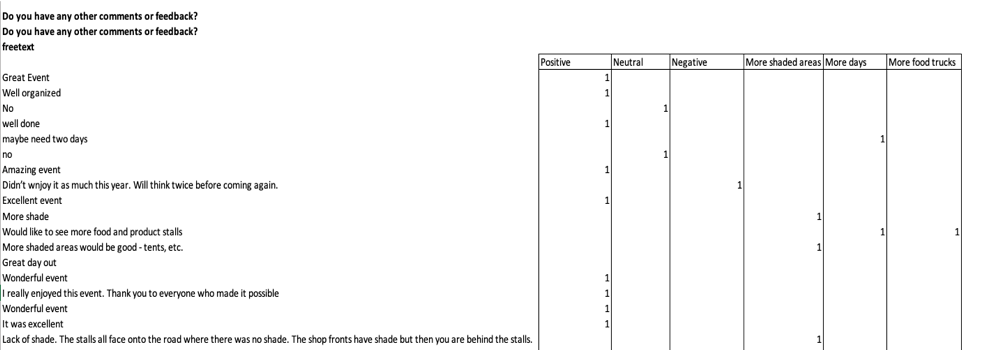
Assign a number to each category.
Here’s where things become interesting, place a number (1) for each free-text comment corresponding to a category (see example below).
Step 6
Make sure you have selected the right categories by having a quick scan through.
If needed, you can assign multiple categories to one response as free-text comments may cover more than one category.
Example: I wish there were more food trucks options. Shade was also a problem. You’d think that some shading will be provided in the middle of Australian Summer. Too bad because the show was quite enjoyable!
We’d classify this comment under Neutral, More food trucks, More shaded areas.
You might find it easier to pick two to three of the most common comments as themes (in this example, shade and food trucks) and group other comments according to their overall sentiment (positive, neutral or negative). If you’re unsure about the tone of the response, you’ve got yourself a neutral!
Step 7
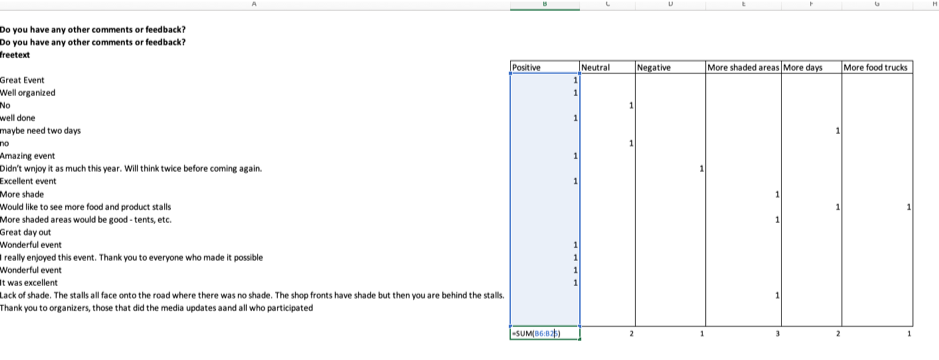
Do the sums!
Once you’re done with assigning numbers to each comment, you can do a quick sum for each category.
Step 8
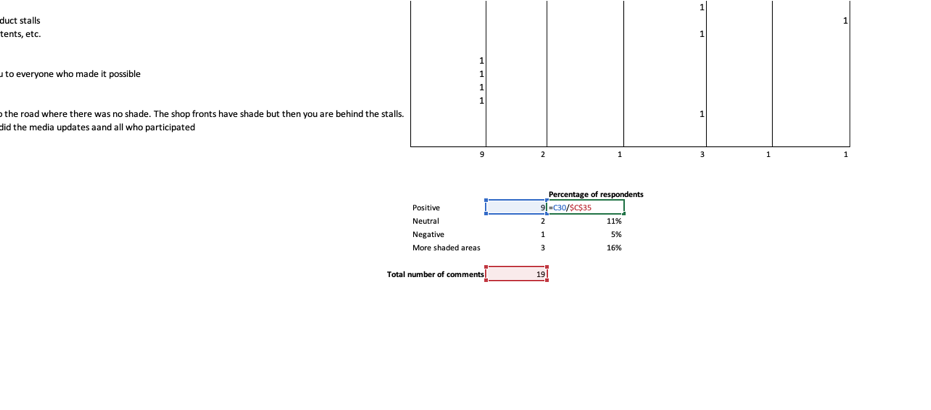
Assign a percentage.
Once you’ve obtained a sum of the number of comments for each category you need to count how many total comments you have and divide each result by this total (percentages, here we are!)
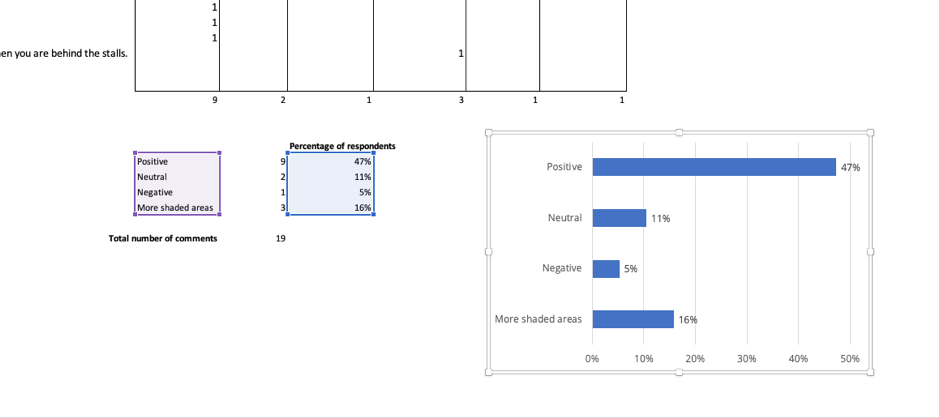
Step 9
Create a chart.
You can create a chart with generic results: positive, neutral and negative as well as one for specific themes. Here at Culture Counts, we’d usually provide a breakdown by positive, neutral and negative followed by a written indication of what the most common themes were.
Any questions about reporting? Get in touch with us to find out more about our services and how we can help!