Background
Revealed Art Market
The Department of Local Government, Sport and Cultural Industries (DLGSC) used Culture Counts to survey people attending the Revealed Art Market in April 2019. As part of the evaluation, surveys were captured from 121 members of the public, 5 peer assessors and 7 self assessors.
Each survey contained nine ‘dimension’ questions, asking the respondent about their experience of the event. These artistic quality dimensions have been developed with the arts sector to measure the impact and value of arts and cultural events.
Evaluation Methodology
DLGSC engaged Culture Counts to conduct an evaluation of the event. Public, peer and self Surveys were delivered in partnership with Culture Counts. The survey was designed and developed to evaluate the strategic goals and outcomes of the Revealed Art Market.
Each survey contained a range of ‘dimension’ questions, asking members of the public about their experience of the event. These dimensions have been developed and tested in collaboration with industry, practitioners and academics to measure the impact and value of arts and cultural events and activity.
Appropriate dimensions were chosen based on their alignment with DLGSC strategic objectives.
Public Assessment
| Domain | Dimension | Dimension Statement |
|---|
| Cultural | Authenticity | It had a connection to the State/Country we live in |
| Inquisitiveness | It encouraged me to find out more about the art |
| Meaning | It moved and inspired me |
| Economic | Collaboration | It connected other artists |
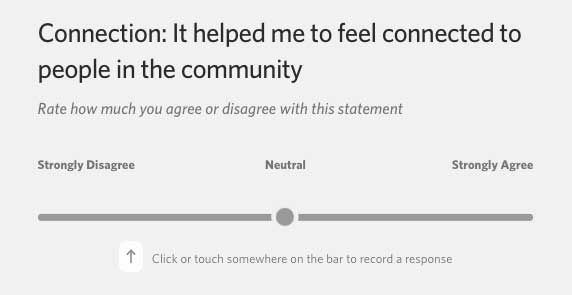
| Social | Connection | It helped me to feel connected to my local community |
| Quality | Distinctiveness | It was different from things I've experienced before |
| Excellence (national) | It is amongst the best of its type in Australia |
| Local Impact | It's important that it's happening here |
| Rigour | It was well thought through and put together |
Dimensions are assessed on a Likert scale, in which respondents move a slider to a point that indicates whether they agree or disagree with the dimension statement. An example of a dimension question in the Culture Counts survey tool is presented below.