Background
Perth International Cabaret Festival
Perth International Cabaret Festival (PICF) is a brand new addition to Perth's arts, culture and storytelling landscape; inspired by a vision to deliver a Festival of indulgence in all things cabaret. After establishing itself as a not-for-profit organisation in 2019, PICF premiered in 2021 and took place from 19 – 27 June. The Festival successfully supported a number of local and national artists, creating a dazzling and inspirational atmosphere at His Majesty's Theatre filled with humour and glamour.
Western Australia’s border restrictions due to Melbourne’s COVID-19 lockdown in May/June 2021 caused several late programming changes but despite this, the Festival was a great success. PICF delivered a high-quality program and provided vibrant entertainment while honouring a full range of cabaret styles and cultures.
Evaluation Methodology
PICF engaged Culture Counts to conduct an evaluation of the event by surveying members of the general public, participants, organisers of the event and sector peers. Surveys were delivered through online delivery links organised by Culture Counts and Perth Theatre Trust. In partnership with Culture Counts, this survey was designed and developed to evaluate the strategic goals and outcomes of PICF and its partners.
246 responses were collected from public attendees via online delivery links sent to the email addresses of ticket holders. 13 responses were captured from Festival participants, including performing artists.
Each survey contained a range of ‘dimension’ questions, asking members of the public and participants about their experience of the event. These dimensions have been developed and tested in collaboration with industry, practitioners and academics to measure the impact and value of arts and cultural events and activities.
Appropriate dimensions were chosen based on their alignment with PICF's strategic objectives.
Public/Participant Assessment
| Domain | Dimension | Dimension Statement |
|---|
| Cultural | Meaning | It moved and inspired me |
| Content | It reflected a broad and inclusive range of voices |
| Heritage | It made me feel connected to a shared history/culture |
| Social | Access | It gave me the opportunity to access cultural activities |
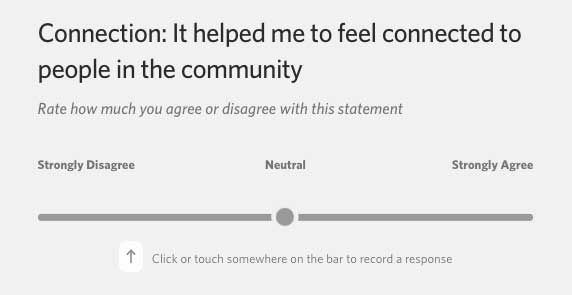
| Connection | It helped me to feel connected to people in the community |
| Economic | Networks | It connected me with other people in my field |
| Collaboration | It provided opportunities for collaboration |
| Diversity | It engaged people from different backgrounds |
| Quality | Presentation | It was well produced and presented |
| Excellence | It was one of the best examples of its type that I have seen |
| Risk | The artists weren't afraid to try new things |
Dimensions are assessed on a Likert scale, in which respondents move a slider to a point that indicates whether they agree or disagree with the dimension statement. An example of a dimension question in the Culture Counts survey tool is presented below.
Cover page image: Gina Williams and Guy Ghouse - Koorlangka Reimagined
Cover page credit: Vanessa Cooper