10
Dimension Metrics
85
Survey Responses
At the forefront of contemporary practice, John Curtin Gallery is embraced by its audience as a centre for learning and research, and also as a place of thoughtful contemplation.
Aspiring to bring to its audiences, from within Curtin University and well beyond, opportunities to experience and critically engage with the visual culture of our time. Exploring the infinite possibilities engendered by art, the exhibitions, events, and public programs offered by the Gallery are a catalyst for thought, change, and exchange. John Curtin Gallery provides a forum for examining the past and how it shapes the present, and for imagining the future.
As one of Western Australia’s major public art galleries located on the Bentley campus of Curtin University, the John Curtin Gallery enlivens the intellectual life of the University and its surrounding communities through exhibitions, events and public programs that explore global perspectives on contemporary art. Innovative exhibitions and programs complement the international perspective of the University. Collaborating with national and international artists and curators, the Gallery contributes to the dynamic and changing culture of Australia by fostering critical dialogue.
The following report presents the 2023 exhibition attendee and participant responses, identifying outcomes, benefits, and learnings.
John Curtin Gallery engaged Culture Counts to conduct an evaluation of its 2023 Exhibitions. Surveys were completed by visitors at the gallery and were also sent out via email. In partnership with Culture Counts, this survey was designed and developed to evaluate the strategic goals and outcomes of John Curtin Gallery.
85 responses were collected from public attendees via display and online surveys. The below table contains a list of the surveys that have been analysed as part of this report, alongside the respective response count.
| Survey | Responses |
|---|---|
| BUNURU SEASON - Gallery visitor feedback survey | 6 |
| Makuru - Audiences (Workshops, Artist Talks) | 16 |
| SURVEY - BUNURU SEASON Exhibition | 12 |
| SURVEY - CARROLUP Exhibition | 35 |
| SURVEY - MAKURU SEASON | 16 |
Each survey contained a range of ‘dimension’ questions, asking stakeholders about their experience of the event. These dimensions have been developed and tested in collaboration with industry, practitioners, and academics to measure the impact and value of arts and cultural events and activities.
Appropriate dimensions were chosen based on their alignment with the festival's strategic objectives.
| Domain | Dimension | Dimension statement |
|---|---|---|
| Cultural | Curiosity | It sparked my curiosity and made me want to find out more |
| Meaning | It moved and inspired me | |
| Social | Access | It gave me the opportunity to access cultural activities |
| Safe | It made me feel safe and welcome | |
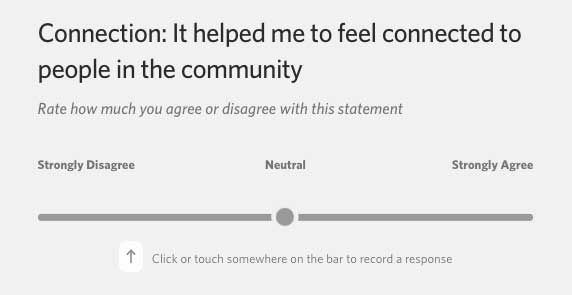
| Connection | It helped me to feel connected to people in the community | |
| Economic | Leverage | It could attract a variety of investors |
| Profile | It raised the profile of the artists | |
| Qualities | Presentation | It was well produced and presented |
| Content | It reflected a broad and inclusive range of voices | |
| Vibrancy | I enjoy the vibrancy and activity here |
Dimensions are assessed on a Likert scale, in which respondents move a slider to a point that indicates whether they agree or disagree with the dimension statement. An example of a dimension question in the Culture Counts survey tool is presented below.
Survey respondents were asked to provide their age, gender, and identity. This data identifies the demographic sample of people who responded to the survey and took part in the event. It enables data to be matched to the wider population and responses to be filtered to understand differences in demographics.
The following charts show the proportion of survey responses captured for each of the age, gender, and identity demographic questions.
The largest age group of respondents overall were aged over 60 (43%) and 50-59 (31%). This was followed by those aged 30-39 (14%), 40-49 (10%), and under 20 (2%).
Three-quarters (75%) of respondents were female, with the remaining 25% identifying as male.
40% of the overall sample identified as being born overseas or having a parent born overseas. 10% of respondents identified as a person with disability, 7% identified as LGBTQIA+, 5% reported speaking a language other than English at home and 2% were Aboriginal and/or Torres Strait Islander. 2% identified as a carer for a person with disability.
Survey respondents were asked to provide their current living location and postcode. This data identifies the demographic sample of people who responded to the survey and took part in the event. It enables data to be matched to the wider population and responses to be filtered to understand differences in demographics.
The following charts show the proportion of survey responses captured for respondents' identified living location and top suburb results.
Of the respondents who answered the location origin question, 50% identified being from the local area, and the remaining 50% were from elsewhere in WA. No one indicated that they were from interstate or overseas.
The most cited suburb was Wonthella (8.5%), followed by Quindanning (6.4%), Bramley (6.4%) and Maylands (4.3%).
Survey respondents were asked to indicate whether they had any affiliation or connection to Curtin University. This allows the gallery to better understand the nuanced profiles of its attendees within the context of the university, throughout programs held over the year.
17% of respondents reported being current Curtin University Staff. Those who identified as a student from outside Curtin or Curtin Alumni together made up 14% of the sample, and current Curtin students made up 7%.
Attendees of the various programs were asked to indicate whether this was their first time attending John Curtin Gallery. This allows for an understanding of the engagement types and reach of the different exhibitions with new and existing audiences.
17% of respondents in 2023 indicated that their visit to John Curtin Gallery was their first ever, with the remaining 83% demonstrating that they had been there before.
Survey respondents moved a slider to indicate whether they agreed or disagreed with the included dimension statements in relation to the event. The first tab chart contains the response data for 'public' responses, showing the average result for each dimension.
The second tab shows the interquartile range of responses for each dimension. These ranges represent the middle 50% of responses, which are areas on the slider where most responses typically fell. Accompanying this range is the median result for each dimension (i.e. the most common response). Smaller ranges indicate similarity in agreement between respondents, whereas larger ranges indicate a wider spread of responses.
The Culture Counts platform provides various methods to capture survey responses at a minimal marginal cost. Achieving larger samples enables organisations to be more confident about the average results and that opinions of the survey respondents are representative of all attendees. The accompanying margin of error chart shows the expected differences for the associated dimension results calculated at a 95% confidence level.
'Presentation' (91/100), 'Profile' (90/100) and 'Content' (88/100) achieved the highest results on average out of all ten statements measured. This indicates that respondents were most likely to agree that the event they attended was well produced and presented, that it helped to raise the profile of the artists and that it reflected a broad and inclusive range of voices. 'Meaning' (86/100), and 'Vibrancy' (86/100) also did particularly well, indicating that respondents were also highly likely to agree that the event they attended moved and inspired them and that they enjoyed the activity and vibrancy there.
While still achieving a positive result, 'Leverage' (72/100) and 'Curiosity' (79/100) were the dimensions that received the lowest level of agreement on average, indicating that respondents were least likely to agree that the event they attended could attract a variety of investors, and sparked their curiosity and made them want to find out more.
'Leverage' also had the largest interquartile range, indicating that responses to this statement were the most varied out of all comparable dimensions.
At a 95% confidence level, the margin of error for dimensions ranged from 3.4% to 10%. This means that we can be 95% confident that if we surveyed the entire visitor population, the average outcome for 'Meaning' would fall within 3.4% of the average generated by the sample.
Respondents were asked about their overall experience of attending John Curtin Gallery exhibitions, with a choice of five options - Excellent, Good, Neutral, Poor, and Terrible.
This chart shows the percentage of respondents that rated the events overall across these five options and the results per event.
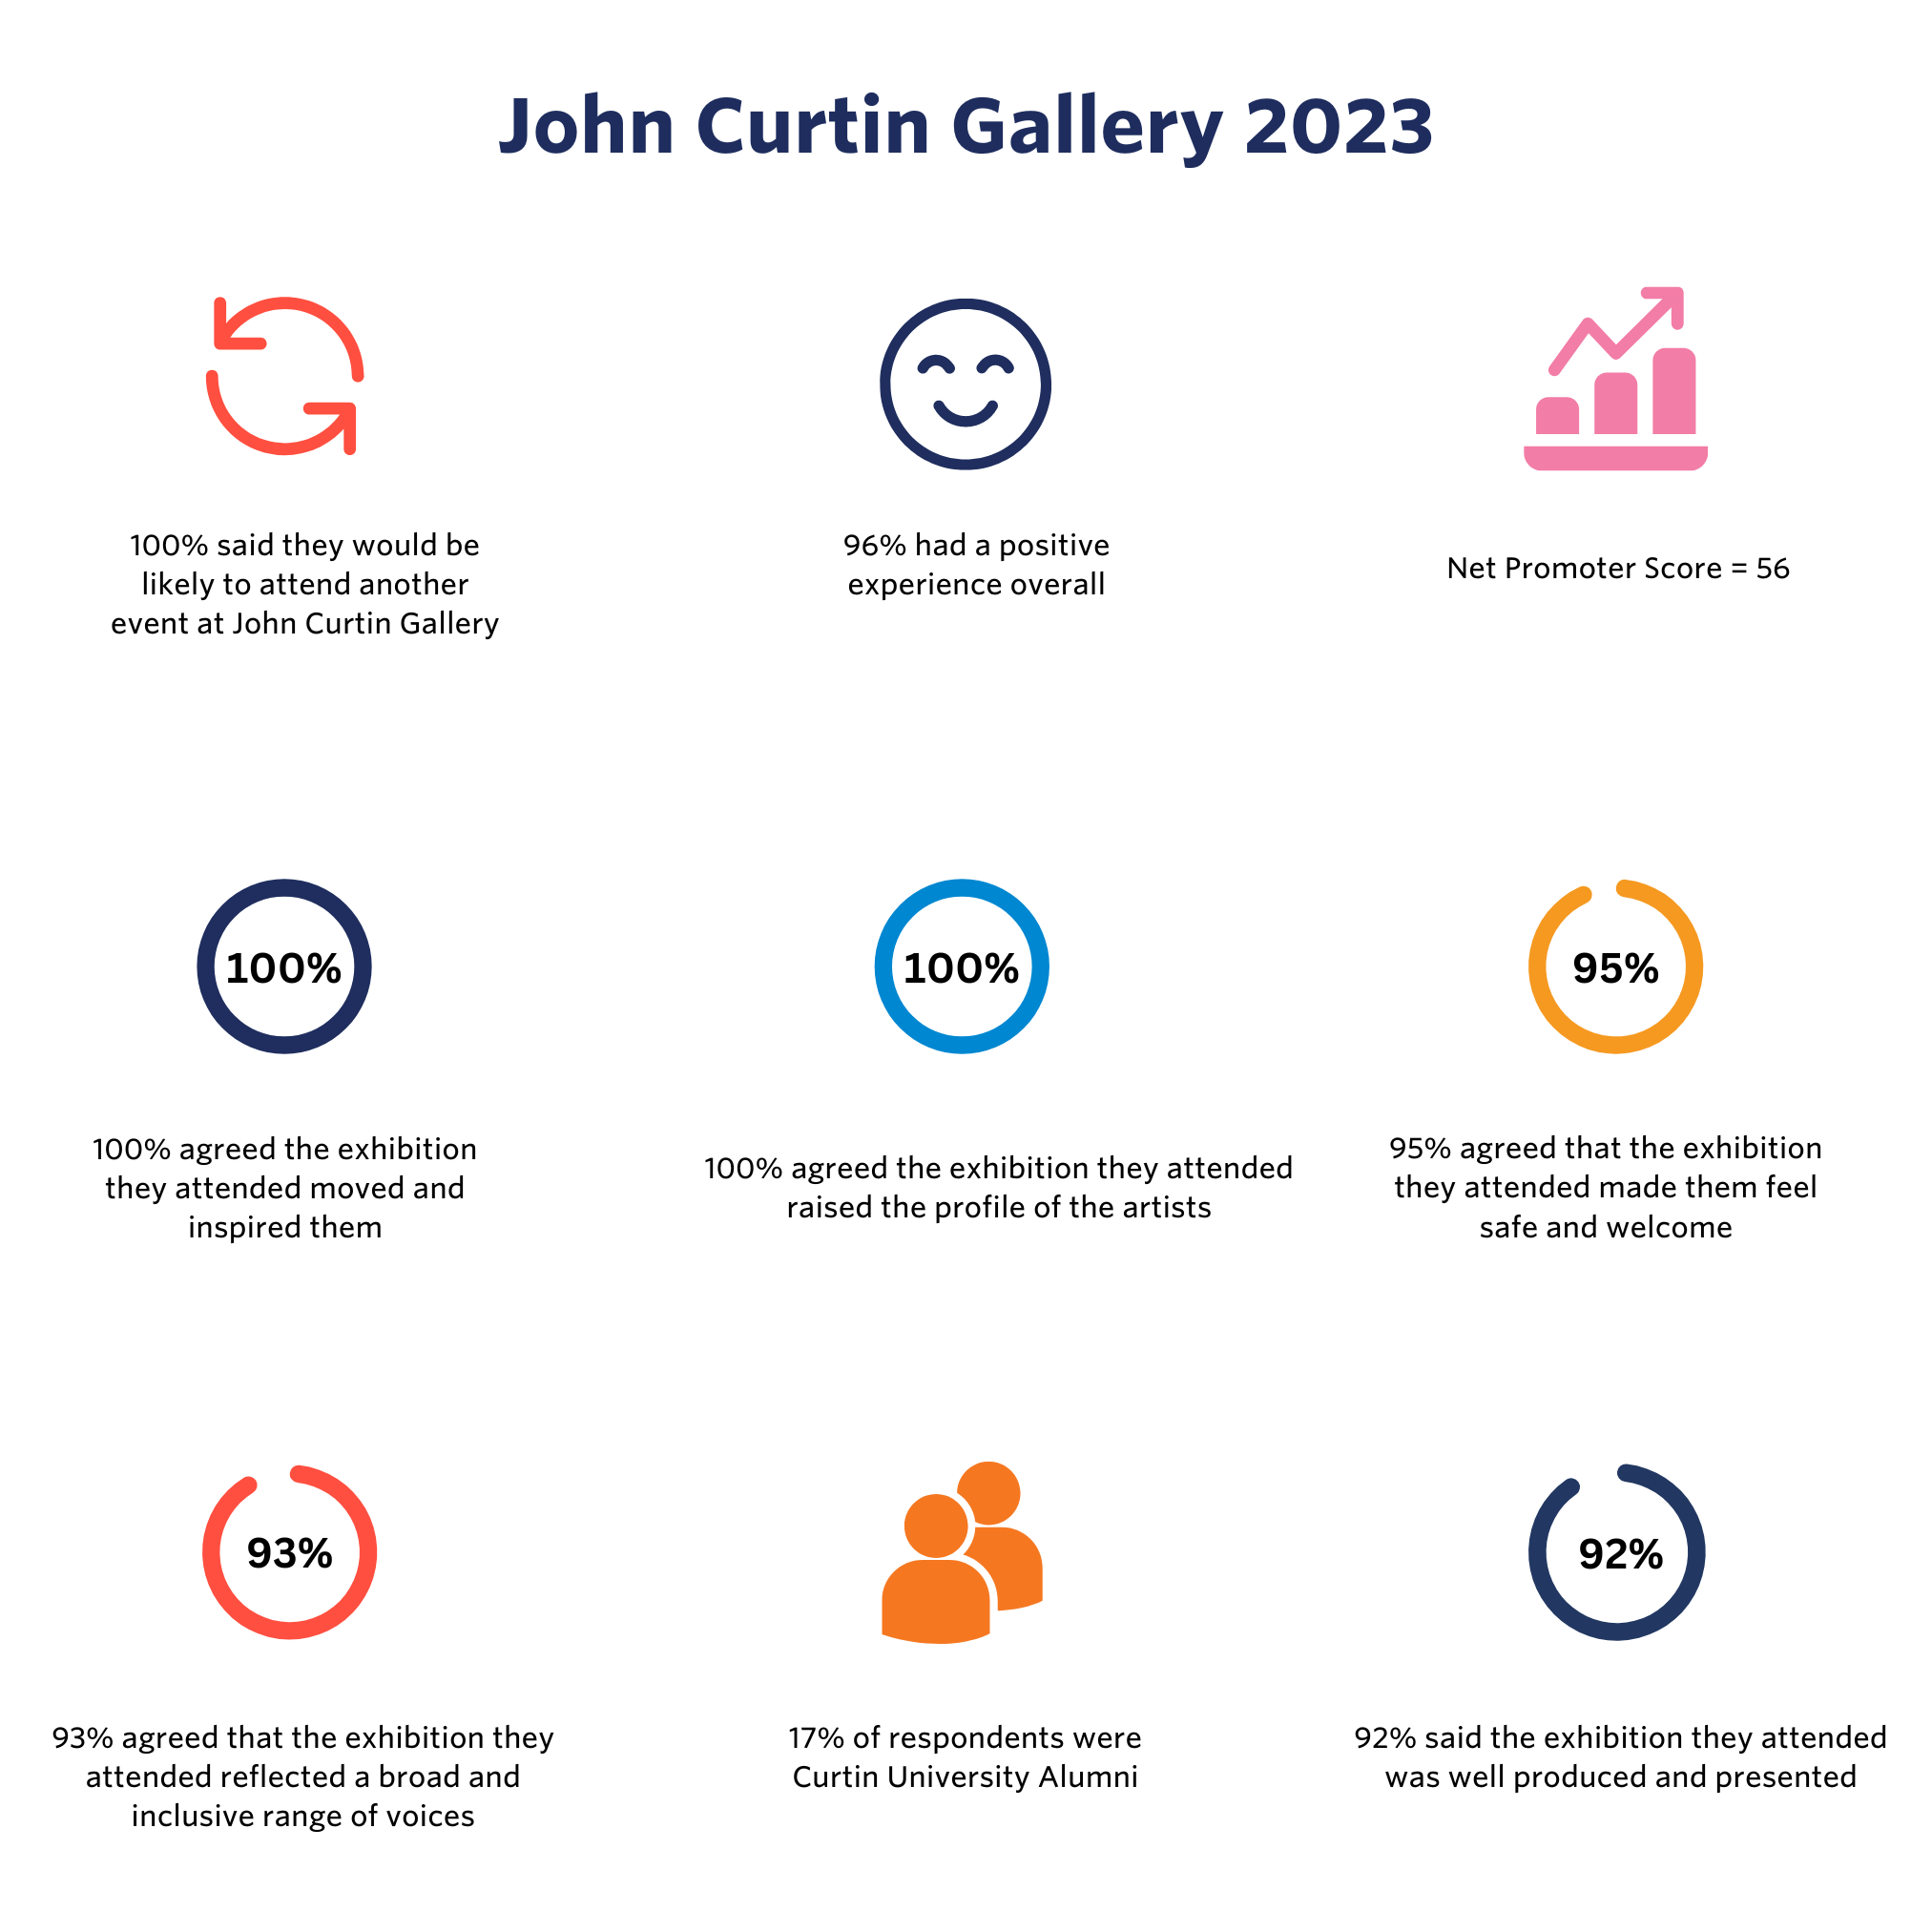
Almost all respondents (96%) reported having a positive experience overall, an excellent result. Of these, just over three-quarters (76%) reported their experience as being excellent and 20% stated it was good. 2% of respondents felt neutral about their experience, 2% had a poor experience and no one reported their experience as being terrible.
Respondents were asked whether they would recommend John Curtin Gallery to a friend or colleague. Respondents could choose a number from 0 to 10 from a menu, with 0 meaning 'not likely at all' and 10 meaning 'extremely likely'.
These results can be used to calculate a Net Promoter Score (NPS). NPS is a standardised metric that seeks to measure loyalty between an organisation and its audience. Respondents with a score of 9 or 10 are considered 'Promoters'. 'Detractors' are those who respond with a score of 0 to 6. Scores of 7 and 8 are considered 'Passives'.
NPS is calculated by subtracting the percentage of respondents who are Detractors from the percentage of customers who are Promoters. This means that an overall Net Promoter Score can range between -100 to +100.
This chart shows the proportion of respondents that would or would not recommend John Curtin Gallery, followed by the calculated NPS below.
71% of respondents responded to the question with either 9 or 10, indicating they would be classified as Promoters. 15% of respondents had passive results (7 or 8) and 13% would be considered detractors (scoring between 0-6).
An NPS that is positive (i.e. higher than zero) is felt to be good, and an NPS of 50+ is excellent. John Curtin Gallery's NPS of 56 indicates that attendees have an excellent level of loyalty towards the gallery and are highly likely to promote it when speaking with others.
Respondents were asked how they heard about the exhibition by selecting options from a multiple-choice list. This allows organisers to determine the effectiveness of various marketing channels used to promote the gallery. Results can be seen as distributed on the chart below.
Almost one-third of respondents (30%) reported finding out about the event they attended via 'Other website', followed by those who cited 'John Curtin Gallery E-News' (27%), 'John Curtin Gallery Website' (20%) and 'Curtin University Website' (17%).
'Word of mouth' was the least common method through which people found out about an event. However, this question was asked inconsistently and this option was not included in all of the surveys.
Respondents were asked to indicate whether they would be likely to return to John Curtin Gallery again, based on the experience of the event they attended. Responses can be seen distributed on the chart below.
The entire sample of respondents (100%) indicated that they would be likely to attend another event by John Curtin Gallery, based on their experience in 2023, an excellent result.
Respondents were asked to leave any additional feedback about their experience at John Curtin Gallery exibitions. This feedback has been classified into positive, neutral, or negative categories, with the percentage of feedback sentiment types presented in the following chart.
Feedback helps organisations understand where the value of visitor experiences lies and how they can be improved and strengthened in the future. A selection of comments have been highlighted underneath.
one of the best exhibitions I have been to in a while! Congratulations on content as well as presentation. The opening evening was a fabulous night. One suggestion - with the welcome to country, it would have been great to be able to pick up a flyer or similar with the Nyoongar words on it so as to respectfully repeat the sentences we were asked to say. I felt awkward not hearing the speaker clearly and having to repeat her words. Lovely to be asked to speak in language.
Staff were excellent, attentive and informed. The exhibition installation was 1st class with all works sensitively-installed and lit, with appropriate labels and an excellent catalogue.
Hearing the artists speak about their practice and the inspiration leading to their art pieces was intriguing and very moving. The overall presentation by the curator was wonderful.
LOVE your work JCG team.
Great to feel part of a creative community, to share a space
Fabulous exhibition, beatifully curated and a real treat
Very well curated - thank you for putting it on.
Informative experience in a venue with helpful compassionate and dedicated staff
I was impressed with the lighting illuminating all the artworks - the darkened gallery with the spotlights enhanced all the artworks.
I was moved and also compelled to know more about the artists and their political and social commitment.
This report has been prepared by Culture Counts. The authors would like to thank all stakeholders and staff for their participation in this research.
Approved by: Laura Doyle
Date of Approval: 9 February 2024.
We respectfully acknowledge the Traditional Owners of Country throughout Australia and recognise the continuing connection to lands, waters and communities. We pay our respect to Aboriginal and Torres Strait Islander cultures, and to Elders past and present.