Background
Midsumma Festival
Midsumma is one of Australia's most renowned queer arts and cultural organisations and for over thirty years has been at the forefront of creating greater visibility, career development opportunities and incredible events for LGBTQIA+ artists, practitioners and audiences alike.
Midsumma's primary event – Midsumma Festival – ran from Sunday 21 January to Sunday 12 February in 2023, and featured over 200 events that showcased diverse art forms and genres, including visual arts, live music, theatre, spoken word, cabaret, film, parties, sport, social events, and public forums.
Taking place, across the Melbourne metropolitan area and regional Victoria, Midsumma Festival 2023 attracted an audience of 306,820 who were drawn by the action-packed program featuring local, national and national performers, and major events such as Midsumma Carnival, Midsumma Pride March and Victoria's Pride Street Party, as well as smaller bespoke events, all of which tapped into the many hidden and mainstream facets of LGBTQIA+ culture, making for one enormously fun celebration.
Evaluation Methodology
Midsumma engaged Culture Counts to conduct an evaluation of this year’s festival. Surveys were distributed via interview by Midsumma volunteers across Midsumma Festival, as well as an open link to the online survey via the Midsumma website and e-newsletter.
In total, 1,179 members of the public were surveyed through interviews and online surveys.
This report includes data from the Victoria's Pride survey, a standalone event as part of the Midsumma Festival 2023 program.
Each survey contained a range of ‘dimension’ questions, asking members of the public about their experience of the event. These dimensions have been developed and tested in collaboration with industry, practitioners and academics to measure the impact and value of arts and cultural events and activities.
Appropriate dimensions were chosen based on their alignment with Midsumma Festival's strategic objectives.
Public Assessment
| Domain | Dimension | Dimension Statement |
|---|
| Cultural | Meaning | It moved and inspired me |
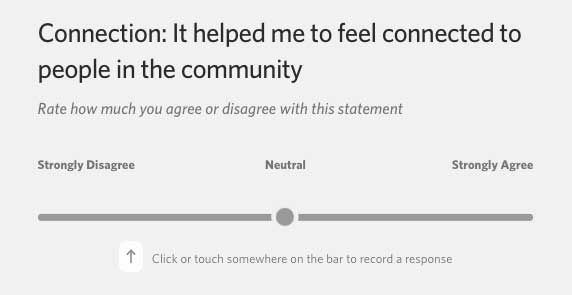
| Social | Connection | It helped me to feel connected to people in the community |
| Safe | It made me feel safe and welcome |
| Wellbeing | It had a positive impact on my physical health and mental wellbeing |
| Quality | Local Impact | It's important that it's happening here |
Dimensions are assessed on a Likert scale, in which respondents move a slider to a point that indicates whether they agree or disagree with the dimension statement. An example of a dimension question in the Culture Counts survey tool is presented below.
Collected Data
| Evaluation | Survey | Responses |
|---|
| Midsumma 2023 | Midsumma Festival 2023 - Event Producer Survey | 57 |
| Midsumma 2023 | Midsumma Festival 2023 - Public Survey | 814 |
| Midsumma 2023 | Midsumma Festival 2023 - Volunteer Survey | 61 |
| Midsumma 2023 | Midsumma Pride March 2023 - Participant Survey | 56 |
| Victoria's Pride 2023 | Victoria's Pride 2023 | 175 |
Note that 'public' data shown in the charts below comes from the surveys 'Victoria's Pride' and 'Midsumma Festival 2023 - Public Survey' only.