Background
Art Month Sydney
Each March, Art Month Sydney celebrates the significance and vibrancy of Sydney’s art scene. As a platform for emerging and established artists, the festival attracts art enthusiasts from across the city – encouraging everyone to experience the work of local creators in new and enjoyable ways.
Throughout the month, each event ignites discussion and creates pathways to inspire the next generation of contemporary art lovers and collectors. Art Month Sydney is operated by the Australian Art Events Foundation, which is a not-for-profit organisation.
Evaluation Methodology
The Australian Art Events Foundation engaged Culture Counts to conduct an evaluation of the festival by surveying members of the general public. In partnership with Culture Counts, this survey was designed and developed to evaluate the strategic goals and outcomes of the Australian Art Events Foundation and Art Month Sydney.
135 responses were collected from public attendees via online delivery links sent to the email addresses of festival attendees.
Each survey contained a range of ‘dimension’ questions, asking stakeholders about their experience of the festival. These dimensions have been developed and tested in collaboration with industry, practitioners and academics to measure the impact and value of arts and cultural events and activities.
Appropriate dimensions were chosen based on their alignment with the Australian Art Events Foundation's strategic objectives.
Public Assessment
| Domain | Dimension | Dimension statement |
| Cultural | Curiosity | It sparked my curiosity and made me want to find out more |
| Contemporary Art | I feel more confident around contemporary art |
| Social | Access | It gave me the opportunity to access cultural activities |
| Inclusion | It made me feel welcome and included |
| Civic | Participation | It encouraged me to participate in community activities |
| Economic | Profile | It raised the profile of the artists |
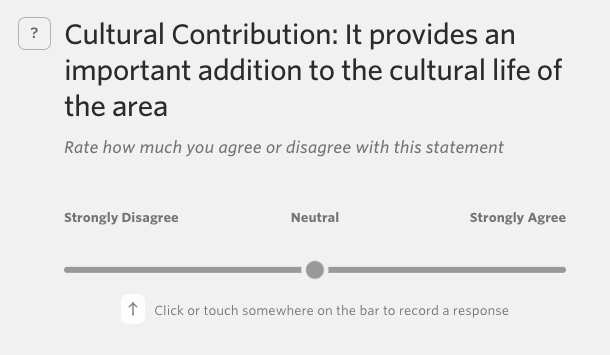
| Quality | Cultural Contribution | It provides an important addition to the cultural life of the area |
Dimensions are assessed on a Likert scale, in which respondents move a slider to a point that indicates whether they agree or disagree with the dimension statement. An example of a dimension question in the Culture Counts survey tool is presented below.