Use your keyboard arrow keys to navigate
Download Report
Bubble Show for Adults Only Photo: David O'Donnell
278k
Tickets Sold
3.3k
Survey Responses
$33.6m
Direct Economic Impact

Contents

Crème de la crème — Photo: Adrian Thomson

Background

ARTRAGE 2021/22

ARTRAGE is one of Western Australia's oldest and most prominent arts organisations. Established in 1983, ARTRAGE has developed and presented numerous key cultural events and festivals that enrich and evolve the culture of Western Australia. ARTRAGE produces the FRINGE WORLD Festival, Rooftop Movies, and the Girls School Cinema precinct.

FRINGE WORLD Festival is the largest activity operated by ARTRAGE. The festival is Perth's massively popular open-access multi-arts festival that is enjoyed annually by hundreds of thousands of people. The incredible array of entertainment presented at the FRINGE WORLD Festival offers something for everyone, from comedy, music and musicals, circus, and much more.

The 2022 Festival was held from 14 January – 13 February and was smaller than normal in scale and scope because of COVID-19, including border restrictions and mask mandates in venues. The exciting program still attracted over 400,000 attendees across its free and ticketed activities, engaging 2,120 artists across the festival.

Evaluation Methodology

ARTRAGE engaged Culture Counts to evaluate FRINGE WORLD Festival, as well as to assess the economic impact of its three major activities. The evaluation was conducted by surveying members of the public. Surveys were delivered through intercept interviews organised by Culture Counts and distributed by ARTRAGE. In partnership with Culture Counts, this survey was designed and developed to evaluate the strategic goals and outcomes of ARTRAGE.

3,345 responses were collected from public attendees via intercept interviews and online delivery links sent to the email addresses of ticket holders.

Each survey contained a range of 'dimension' questions, asking stakeholders about their experience of the event. These dimensions have been developed and tested in collaboration with industry, practitioners, and academics to measure the impact and value of arts and cultural events and activities.

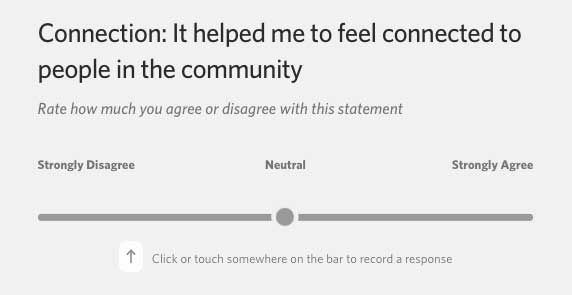
Appropriate dimensions were chosen based on their alignment with FRINGE WORLD Festival's strategic objectives. In 2021/22 a new social dimension 'Connection' was added to the public assessment.

Public Assessment
DomainDimensionDimension Statement
SocialAccessIt gave me the opportunity to access activities I would otherwise not have access to
ConnectionIt helped me to feel connected to people in the community
SafeIt made me feel safe and welcome
WellbeingIt helped me to enjoy a greater quality of life
QualityCaptivationIt held my interest and attention
DistinctivenessIt was different from things I've experienced before
PresentationIt was well produced and presented
CulturalMeaningIt moved and inspired me
RelevanceIt gave me a better understanding of today's world
PlacePlaceIt made me feel proud of my local area
Peer and Self Assessment
DomainDimensionDimension statement
QualityPresentationIt was well produced and presented
DistinctivenessIt was different from things I've experienced before
RigourIt was well thought through and put together
RiskThe artists were not afraid to try new things
PlacePlaceIt made me feel proud of my local area

Dimensions are assessed on a Likert scale, in which respondents move a slider to a point that indicates whether they agree or disagree with the dimension statement. An example of a dimension question in the Culture Counts survey tool is presented below.

likert scale example
ONSEN — Photo: Alex Mansour

Aggregate Attendee Profile

Demographics

Survey respondents were asked to provide their age, gender, and identity. This data identifies the demographic sample of people who responded to the survey and took part in the event. It enables data to be matched to the wider population and responses to be filtered to understand differences in demographics.

The following charts show the proportion of survey responses captured for each of the age and gender questions.

Loading...
Loading...
Loading...
Note: FRINGE WORLD Festival age question was asked differently to Girls School Cinema and Rooftop Movies, so has been excluded from results.
Loading...
Loading...
Loading...
Loading...

Insights

Most respondents across all events were aged 30-39 (26%) or 40-49 (25%). This was followed by those aged 20-29 (21%), 50-59 (19%), over 60 (6%) and under 20 (3%). Similar trends were seen from respondents who attended events at Girls School Cinema with most respondents being aged 30-39 (26%) or 40-49 (27%), with only 7% of respondents being over 60 and less than 1% being under 20. Similarly, for Rooftop Movies most respondents were aged 30-39 (26%), 40-49 (24%) or 20-29 (23%), with only 6% being over 60 and 3% being under 20.

The majority (77%) of the total sample were female, with males making up 21%. Less than 1% of the total sample identified their gender in another way. Similarly, 74% of respondents from FRINGE WORLD Festival identified as female, with 25% identifying as male and 1% identifying in another way. This varied slightly for Girls School Cinema where 88% of respondents identified as female, 11% as male and less than 1% in another way. A similar trend was seen for Rooftop Movies respondents where 84% identified as female, 15% identified as male and 1% identified in another way.

Briefs: Bite Club — Photo: Matthew Gedling

Location & Postcode

Survey respondents were asked to provide their current living location and postcode. This data identifies the demographic sample of people who responded to the survey and took part in the event. It enables data to be matched to the wider population and responses to be filtered to understand differences in demographics.

The following charts show the proportion of survey responses captured for those who identified their living location and top postcode results.

Loading...
Loading...
Loading...
Loading...
Loading...

Insights

Most respondents across all events were from the Perth Metro Area (75%), followed by those who live in the City of Perth (21%) and elsewhere in WA 3%. Interstate and overseas tourists made up less than 1% each. Trends were similar across FRINGE WORLD Festival, Girls School Cinema and Rooftop Movies surveys, with no significant differences in respondent's location based on the event.

Respondents travelled from all over Perth to attend the events, with Perth (3.6%) being the most cited postcode, followed by Bibra Lake (3.1%), Churchlands (3.0%) and Tuart Hill (2.6%).

Aria Reprise — Photo: Sophie Hirt

Prior Attendance

Respondents were asked to indicate whether this was their first-time attending FRINGE WORLD Festival or Rooftop Movies. Responses can be seen distributed on the chart below.

Loading...
Loading...
Note: Girl School Cinema prior attendance question was asked differently to FRINGE WORLD Festival and Rooftop Movies, so has been excluded from results.

Insights

The majority of respondents (84%) indicated that they had attended FRINGE WORLD Festival in previous years, with the remaining 16% being first-time attendees. 93% of respondents had attended Rooftop Movies in previous years with 7% being first-time attendees. These results show a high level of attendee loyalty and the events' ability to attract new audiences.

Dreams of a Lonely Planet — Photo: Sophie Hirt

Outcomes

Survey respondents moved a slider to indicate whether they agreed or disagreed with the included dimension statements concerning the event. The following charts contain the response data for 'public' responses, showing the average result for each dimension.

Respondents were asked to name a show or performance they recently attended as part of FRINGE WORLD Festival and were asked to consider that experience as part of the survey response. This evaluation methodology was tested in the 2021 FRINGE WORLD Festival report.

The Culture Counts platform provides various methods to capture survey responses at a minimal marginal cost. Achieving larger samples enables organisations to be more confident about the average results and that opinions of the survey respondents are representative of all attendees. The accompanying margin of error chart shows the expected differences for the associated dimension results calculated at a 95% confidence level.

FRINGE WORLD Festival Outcome Averages

Loading...
Loading...

Insights

Of all 10 dimensions measured, 'Captivation' (84/100), 'Presentation' (83/100) and 'Safe' (78/100) received the highest average results overall. This indicates that respondents were most likely to agree that the event they attended held their interest and attention, that it was well produced and presented, and that it made them feel safe and welcome.

'Distinctiveness' (76/100), 'Wellbeing' (73/100) and 'Access' (73/100) also scored highly, indicating that respondents were also likely to agree that it was different from things they'd experienced before, it helped them to enjoy a greater quality of life and that it gave them the opportunity to access activities they otherwise would not have access to.

'Meaning' (67/100) and 'Relevance' (59/100) received the lowest average scores, indicating that of all comparable dimensions, respondents were less likely to agree that the event they attended moved and inspired them or that it gave them a better understanding of today's world.

At a 95% confidence level, the margin of error for dimensions ranged from 1.0% to 3.7%. This means that we can be 95% confident that if we surveyed the entire visitor population, the average outcome for 'Presentation' would fall within 1.0% of the average generated by the sample.

Fringe Freak Out — Photo: Jason Matz

FRINGE WORLD Agreement

Culture Counts uses a slider input to measure responses for dimension statements as part of the evaluation methodology. This method also provides the capability to understand response results within a typical 5-point agree-to-disagree format.

The following charts contain the response data for 'public' responses. The first chart shows the percentage of people that agreed or disagreed with each of the statements, using a 5-point ordinal Likert scale.

The second chart shows the interquartile range of responses for each dimension. These ranges represent the middle 50% of responses, which are areas on the slider where most responses typically fell. Accompanying this range is the median result for each dimension (i.e. the most common response). Smaller ranges indicate similarity in agreement between respondents, whereas larger ranges indicate a wider spread of responses.

Loading...
Loading...

Insights

'Captivation' (90%), 'Presentation' (90%) and 'Safe' (81%) received the highest levels of overall agreement. This indicates that most respondents agreed that the event they attended held their interest and attention, that it was well produced and presented, and that it made them feel safe and welcome.

'Relevance' (45%) received the lowest level of overall agreement, suggesting that respondents were least likely to agree that the event gave them a better understanding of today's world. 'Relevance' also had a small interquartile range, indicating that most respondents agreed with the median score of 52/100.

'Connection' had the smallest interquartile range suggesting that there was little variation in the result for this statement, from the perspective of respondents. 'Place', 'Access' and 'Wellbeing' had the largest interquartile ranges, indicating that responses to these statements were the most varied out of all comparable dimensions. Given that respondents were asked to consider their response concerning the show or performance they experienced, this suggests that results are more likely to be affected by this variable.

Briefs: Bite Club — Photo: Matthew Gedling

Sunday Funday Outcomes

Sunday Funday is a free event hosted and organised by ARTRAGE as part of FRINGE WORLD Festival. Attendees at this event were asked a smaller set of dimension questions about their experience.

Survey respondents moved a slider to indicate whether they agreed or disagreed with the included dimension statements concerning the event. The following charts contain the response data for 'public' responses, showing the average result for each dimension.

The Culture Counts platform provides various methods to capture survey responses at a minimal marginal cost. Achieving larger samples enables organisations to be more confident about the average results and that opinions of the survey respondents are representative of all attendees. The accompanying margin of error chart shows the expected differences for the associated dimension results calculated at a 95% confidence level.

Loading...
Loading...
Loading...

Insights

'Place' and 'Access' (both at 75/100) received the highest average scores overall. This indicates that respondents were most likely to agree that the event made them feel proud of their local area and that it gave them the opportunity to access opportunities they would otherwise not have access to. Despite still being positive, 'Connection' (70/100) received the lowest average score, indicating that of all comparable dimensions, respondents were least likely to agree that the event they attended helped them to feel connected to people in the community.

In terms of overall agreement, the results were slightly different. 'Captivation' (84%) and 'Access' (83%) received the highest levels of overall agreement, suggesting that respondents were most likely to agree that the event they attended held their interest and attention and gave them the opportunities to access activities they otherwise would not have access to. 'Wellbeing' received the lowest level of overall agreement, although the result was still positive (79% overall agreement). This suggests that respondents were least likely to agree that the event they attended helped them to enjoy a greater quality of life.

Despite receiving the lowest median scores, the least amount of variation in responses was seen for 'Captivation' and 'Connection'. 'Access' showed the largest interquartile range suggesting there was more variation in results for this statement.

Givana's Messy Friends — Photo: Kaifu Deng

Overall Experience

Respondents were asked about their overall experience of attending FRINGE WORLD Festival, with a choice of five options - Excellent, Good, Neutral, Poor, and Terrible. This chart shows the percentage of respondents that rated the event across these five options.

Loading...
Good + Excellent: 95%

Insights

Most of the sample (95%) reported having a positive experience overall, an excellent result. Of this sample, 64% reported having an excellent experience and 31% reported their experience as being good. 3% of respondents reported having a neutral experience, and less than 1% each reported their experience being poor or terrible.

Always Woods Always Will Be — Photo: Jason Matz

Net Promoter Score

Respondents were asked whether they would recommend FRINGE WORLD Festival to a friend or colleague. Respondents could choose a number from 0 to 10 from a menu, with 0 meaning 'not likely at all' and 10 meaning 'extremely likely'.

These results can be used to calculate a Net Promoter Score (NPS). NPS is a standardised metric that seeks to measure loyalty between an organisation and its audience. Respondents with a score of 9 or 10 are considered 'Promoters'. 'Detractors' are those who respond with a score of 0 to 6. Scores of 7 and 8 are considered 'Passives'.

NPS is calculated by subtracting the percentage of respondents who are Detractors from the percentage of customers who are Promoters. This means that an overall Net Promoter Score can range from -100 to +100.

This chart shows the proportion of respondents that would or would not recommend FRINGE WORLD Festival, followed by the calculated NPS below.

Loading...
Net Promoter Score: 70

Insights

Almost three-quarters (74%) of respondents scored the festival either 9 or 10, indicating they would be classified as Promoters. 22% of respondents scored passive results (7 or 8) and 4% would be considered detractors (scoring between 0-6).

A positive NPS (i.e. higher than zero) is felt to be good, and an NPS of 50+ is excellent. ARTRAGE's NPS of 70 shows an excellent level of visitor loyalty and a high likelihood of recommendations to friends and colleagues.

Birth of the Blues! Simone Craddock Combo — Photo: Adrian Thomson

Comparison & Benchmarks

Year-on-Year

Dimensions used in this evaluation were also measured in previous years. This consistent use of measurement allows organisers to benchmark their results and track progress in achieving strategic outcomes over time.

The following chart compares the average result of dimension responses for previous years.

Loading...

Insights

All dimensions measured at FRINGE WORLD Festival across the previous two years received higher average dimension scores in 2022 than in 2021, a fantastic result showing improvements in a multitude of areas. Each dimension improved by +3 or +4, suggesting consistent improvement across all areas covered by the dimensions. Interestingly, based on their average score, the dimensions were also ranked in the same order across both years.

Briefs: Bite Club — Photo: Matthew Gedling

Self & Peer Comparison

As part of the evaluation methodology, ARTRAGE staff and sector peers were asked to conduct a 'Prior' survey before the festival commenced. The purpose of the Prior survey is to record the performance expectation of both the staff who are responsible for delivering the event, as well as of sector peers, who are aware of the event and expect to experience it.

After the event, respondents are also asked to conduct a post-event survey. With this survey, prior expectations can be compared to the achieved results. When also compared to public survey responses, this information provides organisers with an effective tool to triangulate results, investigate differences and reflect on their achievements and learnings.

Loading...
Loading...
Note: Public respondents were not asked the Rigour and Risk dimension questions.

Insights

Pre and post comparison of the peer surveys reveals that the outcomes related to 'Presentation', 'Rigour' and 'Place' exceeded peers' expectations. Results from the self surveys show that all outcome results increased after respondents had experienced the event.

In all instances, the self score exceeded the peer score received for each dimension.

My Greatest Period Ever — Photo: Sophie Hert

DLGSC AOIP Benchmarks

In 2020, the Western Australian Department of Local Government, Sport, and Cultural Industries (DLGSC) made benchmarks available from evaluations conducted by all their funded arts and cultural organisations during the 2016 to 2019 period.

Benchmarks give context to organisers so that they can understand the unique impact they deliver through their events and programs, and the outcomes that distinguish them from other offerings. The below chart shows the average dimension results achieved by the FRINGE WORLD Festival, compared to the DLGSC benchmark average and interquartile range (IQR).

Loading...
Count per dimension: 28 < s < 160; 6,144 < n < 23,498. Surveys with less than 30 responses removed prior to analysis. Note: The x-axis starts at 'Neutral' (50). DLGSC benchmarks are not available for the Place, Wellbeing or Safe dimensions.

Insights

Three out of seven comparable dimensions fell within the DLGSC's benchmark range for AOIP organisations. This indicates that results for 'Captivation', 'Distinctiveness' and 'Connection' are in line with other evaluations undertaken by AOIP organisations. The result for 'Connection' was in the upper section of the interquartile range, meaning that this result is above average when compared to the benchmark range.

The result for the remaining dimensions 'Presentation', 'Access', 'Meaning' and 'Relevance' fell below the DLGSC's benchmark range. If ARTRAGE considers these dimensions and their outcomes to be of strategic importance, these could be areas to focus on improving in the future. The open nature of programming for Fringe festivals however may make improvements in these areas more difficult.

Given the smaller IQR for the 'Connection' dimension, this suggests that the atmosphere and festival infrastructure created by FRINGE WORLD Festival is effective at facilitating a sense of connection for attendees, while the 'Relevance' or 'Meaning' of the actual performances within Fringe are more strongly tied to each production itself. Given the wide variety of programming available to audiences at FRINGE WORLD Festival, the benchmark results for 'Captivation' and 'Distinctiveness' may also suggest that these outcomes are of more interest to audiences when selecting the type of programming they would like to attend.

CRUSHERS — Photo: Sophie Hirt

Economic Impact

Spending and Additionality

Spending questions ask survey respondents about how much they spent in the local area on items like shopping, food, beverage, etc. as part of their attendance at the event. Respondents are asked to exclude accommodation or other travel expenses as these are separated as part of the economic impact calculations.

Respondents are also asked what they would have done otherwise if it was not for their attendance at the event. This question is used to determine 'additionality', which is the percentage of spending that could be considered to be additional or could genuinely be attributed to the event. It is statistically defined as one minus the percentage of deadweight (1 - dw%), where deadweight is the economic outcome that would have happened in the absence of activity.

The following charts show the visitor spending and additionality results used in the economic impact analysis, as well as what spending types of respondents reported.

Loading...
FRINGE WORLD Average Visit Spend: $85.79
Loading...
Rooftop Movies Average Visit Spend: $41.82
Loading...
Girls School Cinema Average Visit Spend: $42.49
Loading...
FRINGE WORLD Additionality: 76%
Loading...
Rooftop Movies Additionality: 74%
Loading...
Girls School Cinema Additionality: 97%

Insights

Most respondents reported spending between $0-$50 at FRINGE WORLD Festival (52%), Rooftop Movies (82%) and Girls School Cinema (76%). After outliers were removed, the average visit spent per person was determined as $85.79 (FRINGE WORLD Festival), $41.82 (Rooftop Movies) and $42.49 (Girls School Cinema). This suggests that respondents who attended Rooftop Movies and Girls School Cinema events spent half as much on average as those who attended FRINGE WORLD Festival. A weighting is applied to spend results within the economic impact analysis depending on where respondents come from, and therefore this average result may differ from the weighted average. When both results are very close, it is understood to be a rigorous result.

A large majority of respondents would have stayed home, gone to work, or done something else not in the local area if they had not attended a FRINGE WORLD Festival (76%), Rooftop Movies (74%) or Girls School Cinema (97%) event.

Desia Afrosoul — Photo: Adrian Thomson

Accommodation and Tourism

All survey respondents were asked if they were staying overnight while attending the event, how long they were staying and how much they spent on accommodation.

Survey respondents who identified as living Intrastate, Interstate, or Overseas were asked additional questions about their trip spending and reasons for visiting. This data is used to determine the economic impact of the event on tourism-related spending.

All spending and additionality results are weighted by the attendee's place of origin (i.e. City of Perth, Perth Metro, Elsewhere in WA, Interstate, and Overseas).

Tourism additionality asks respondents how much influence the event had on their decision to visit WA (or Perth, for regional visitors). Tourists that indicated the event was their primary reason for visiting means that 100% of their trip spend is attributable to the event, whereas tourists who were unaware of the event before visiting indicate that the event was responsible for 0% of their trip spend.

A weighted exponential scale of attribution is applied to calculate an overall trip additionality figure in the economic impact calculations (i.e. 100%, 50%, 25%, 5%, 0%).

Loading...
FRINGE WORLD Average Accommodation Spend: $117.86
Loading...
Rooftop Movies Average Accommodation Spend: $136.55
Loading...
Girls School Average Accommodation Spend: $158.33
Loading...
Average Trip Spend: $108.14
Loading...
FRINGE WORLD Weighted Accommodation/Trip Additionality: 43%
Loading...
Note: Due to lower sample size, respondent categories have not been split out for Rooftop Movies.
Rooftop Movies Weighted Accommodation Additionality: 52%
Loading...
Note: Due to lower sample size, respondent categories have not been split out for Girls School.
Girls School Weighted Accommodation Additionality: 43%

Insights

Respondents who said they were staying overnight most spent less than $150 per night (FRINGE WORLD Festival- 73%, Rooftop Movies - 65%, Girls School Cinema - 80%) on accommodation. The average accommodation spend was highest for Girls School Cinema events ($158.33) followed by Rooftop Movies ($136.55) and FRINGE WORLD Festival ($117.86). However, no respondents from Girls School Cinema events spent over $250 on accommodation, compared to 6% of FRINGE WORLD Festival and 15% of Rooftop Movies respondents spending $250-$350 on accommodation.

For tourist visitors attending FRINGE WORLD Festival events, the average trip spend was determined to be $108.14, with most respondents (33%) spending between $0-$50 per day and 28% spending $51-$100 a day per person. Less than 1% spent $351-$400 each day per person. 22% of respondents travelled from the City of Perth, with the main reason being for the event, whilst 60% knew about the event but it wasn't their reason for travel. The majority (57%) of respondents from elsewhere in WA travelled to Perth with FRINGE WORLD Festival being the main reason, and 22% indicated that it was a contributing factor. 17% knew about the event but it didn't influence their decision to travel. Over half (54%) of interstate tourists indicated that FRINGE WORLD Festival was their main reason for travel, with an additional 8% identifying it as a contributing factor. 38% of interstate tourists reported that the event they attended did not influence their decision to travel but they knew about the event prior.

After responses were weighted for all tourist attendees, the tourism additionality of FRINGE WORLD Festival was determined to be 43%, which means that 43% of tourist spending would not have occurred, if not for FRINGE WORLD Festival. Accomodation additionality was calculated to be 52% and 43% for Rooftop Movies and Girls School, respectively.

Fringe Artist Shoot — Photo: Miles Noel

Unique Attendance & Other Expenditure

Other figures are required for the overall economic impact calculations, including Artist Expenditure, Organisational Expenditure, and Unique Attendance.

Unique attendance is required for the calculation of accommodation spending, as it is common for FRINGE WORLD Festival attendees to see multiple events over multiple nights. By determining the unique attendance of the overall festival, we can then apply a percentage figure calculated from survey data to determine the number of accommodation nights generated by the festival.

Artist Expenditure is a significant component of economic impact, due to the large number of artists that are participants in FRINGE WORLD Festival. Artist expenditure includes the daily spending of all artists while participating in FRINGE WORLD Festival, as well as the accommodation and trip expenses from travelling artists who live outside of WA.

Finally, organisational expenditure contributes to the economy by using equipment and services to create the event. FRINGE WORLD Festival also shares box office revenue with artists participating in the festival. As FRINGE WORLD Festival takes in revenue through its provision of food and beverage operations, this revenue is deducted from the average spending of Festival attendees to prevent it from being double counted through organisational expenditure.

Loading...
Note: Reasons for attending other than seeing a ticketed show are shaded. 'One of the excluded reasons' represents the percentage of respondents that picked at least one of the excluded reasons. 'To expose myself/others to the artistic/cultural experience' was removed from the unique attendance methodology in 2022.
Free attendees included in overall attendance: 5%
Unique Attendance - FRINGE WORLD Festival
ATTENDANCE TYPE TOTAL
Total Attendance (Free & Ticketed) 415,899
Ticketed - FRINGE WORLD Festival 233,065
Free - Russell Square, Girls School Cinema & Funday 136,399
Free - New Attendees (Calculation) 6,372
Total In-Scope Attendees 239,437
Average Events Attended Per Person 4.56
TOTAL IN-SCOPE UNIQUE ATTENDEES 52,510
Note: For calculation purposes, it is estimated that approximately 5% of attendees to free events did not attend a ticketed event in the same trip.
Artist Expenditure - FRINGE WORLD Festival
SPEND TYPE # OF ARTISTS AVG NIGHTS AVG SPEND P/NIGHT ADDITIONALITY TOTAL
Daily Spend 2,120 12.3 $39.16 66% $678,100
Accommodation Spend (Non-local Artists) 127 14.7 $72.25 100% $139,691
Artist Trip Spend (Non-local Artists) 127 0.5 $39.16 100% $2,491
TOTAL $820,281
Organisational Expenditure - FRINGE WORLD Festival
SPEND TYPE TOTAL
FRINGE WORLD Organisation Expenditure $4,387,150
FRINGE WORLD Ticket Profit Sharing $5,042,088
* ARTRAGE Food & Beverage Revenue $1,837,076
TOTAL $7,592,162
Note: Food & Beverage Revenue generated by ARTRAGE through its operations have been deducted from Attendee Event Spending. This is to prevent double-counting this spend as part of the Organisational Expenditure component of the economic impact assessment.
VIKINGS — Photo: Ellie Yang

Impact Summary

Survey respondents were asked to estimate how much they had spent as part of their visit, the level of influence on their decision to visit, as well as indicate what they would have done if they had not visited. Combining this data with attendance figures allows an overall impact figure to be generated.

The economic impact is determined by three main factors:

  • Visits/Attendance: The number of people spending money (converted to the number of nights for accommodation and longer trips).

  • Spend: Spending in the local economy. Includes spending as part of a visit, spending on accommodation for those staying overnight, and any other trip-related spending for those staying multiple nights. Excludes spending on tickets or other items that would be captured through organisation expenditure (i.e. to avoid double-counting).

  • Additionality: The percentage of spending that would not have occurred otherwise.

To calculate the economic impact on the local area, only additional visitation is included. From those visits, only expenditure that would not have otherwise occurred is considered. In this case, the economic impact is from attendees who would have otherwise stayed at home, gone to work, or those who would have done something else outside the local area.

The tables below detail a breakdown of visitation by additionality (i.e. new visits to the area because of the event), visitor expenditure (if they came and stayed in the area because of the event and any other spending they did), and total economic output.

Event Spending Impact
PROGRAM ATTENDANCE EVENT SPEND ADDITIONALITY TOTAL
Rooftop Movies 30,123 $41.82 75% $935,918
Girls School Cinema 15,115 $42.09 97% $616,888
FRINGE WORLD Festival 239,437 $99.94 76% $18,187,986
TOTAL 284,564 $90.74 77% $19,740,792
Accommodation & Trip Spending Impact
PROGRAM NIGHTS ACCOM SPEND/NIGHT TRIP SPEND/NIGHT ADDITIONALITY TOTAL
Rooftop Movies 2,076 $136.55 52% $147,053
Girls School Cinema 608 $158.33 43% $41,691
FRINGE WORLD Festival 9,391 $111.75 $112.34 47% $992,519
TOTAL 12,074 $118.36 $112.34 48% $1,181,263
Economic Impact Summary
DIRECT IMPACT MULTIPLIED IMPACT
Attendee Spending (Rooftop) $1,082,971 $3,174,712
Event/Visit $935,918 $2,770,316
Accommodation $147,053 $404,396
Attendee Spending (Girls School Cinema) $658,579 $1,940,639
Event/Visit $616,888 $1,825,990
Accommodation $41,691 $114,650
Attendee Spending (FRINGE WORLD Festival) $19,180,505 $56,644,810
Event/Visit $18,187,986 $53,836,438
Accommodation $528,139 $1,452,383
Trip $464,380 $1,355,989
Organisation Expenditure $11,875,906 $31,708,669
ARTRAGE (Other) $3,246,569 $8,668,339 ​
FRINGE WORLD Festival $7,592,162 $20,271,073 ​
Rooftop Movies $709,304 $1,893,842
Girls School Cinema $327,871 $875,416
Artist Expenditure (FRINGE WORLD Festival) $820,281 $2,398,598
TOTAL $33,618,242 $95,867,428

Note: For the purpose of this analysis, output multipliers derived from ABS Output Tables 2012-13 have been applied to direct impact expenditure.
Event expenditure scaled by an output multiplier of 2.96, the national Food and Beverage multiplier (2.96).

Accommodation expenditure scaled by an output multiplier of 2.75, the national Accommodation multiplier.

Trip expenditure scaled by an output multiplier of 2.92, representing an average of national Retail and, Food and Beverage multipliers (2.88 and 2.96 respectively).

Organisation expenditure scaled by an output multiplier of 2.767, the national Heritage, Creative and Performing Arts multiplier.

YUCK Circus — Photo: Sean Breadsell

Employment, Tourism & Comparisons

Using the Impact Summary, additional analysis has been conducted to report the impact of ARTRAGE activities on employment, as well as the percentage of spending that was undertaken by different types of tourists.

For comparative purposes, other Economic Impact Assessments conducted by Culture Counts have been included. These comparisons represent the direct impact of attendee spending only - that being the spend of attendees outside the event area and any spending on accommodation.

Employment Impact Summary
DIRECT EMPLOYMENT (FTE) MULTIPLIED EMPLOYMENT (FTE)
Attendee Spending (Rooftop Movies) 7.6 13.8
Attendee Spending (Girls School Cinema) 4.8 8.5
Attendee Spending (FRINGE WORLD Festival) 140.8 250.5
Organisation Expenditure 88.3 155.0
Artist Expenditure (FRINGE WORLD Festival) 6.1 11.0
TOTAL 247.6 438.1
Tourism Impact Summary - FRINGE WORLD Festival
DIRECT IMPACT
Attendee Spending $1,754,216
Elsewhere in WA $1,268,560
Interstate $445,206
Overseas $40,450
Artist Spending $142,182
TOTAL $1,896,398
Economic Impact Comparisons
SOURCE ATTENDEES AVG. SPEND ADDITIONALITY DIRECT IMPACT (ATTENDEE SPEND)
FRINGE WORLD Festival 2022 239,437 $114.97 76% $20,922,055
FRINGE WORLD Festival 2021 232,374 $69.78 74% $11,998,832
Perth Festival 2021 473,616 $54.98 73% $19,066,011
Midsumma 2019 101,802 $213.13 55% $11,933,184
PrideFEST 2019 28,079 $107.43 67% $2,020,999
Commonwealth Games Festival 2018 120,188 $84.50 100% $10,155,896
Note: Additionality is sourced from Event Spend only, with the Average Spend figure adjusted accordingly to combine event and accommodation spends. Additionality was not measured for Commonwealth Games 2018 Festival as part of survey methodology.

Direct Employment has been calculated by dividing Direct Impact by the industry-specific Output per FTE figure. This figure is then multiplied by the relevant employment multiplier to estimate Multiplied FTE. For this analysis, Output per FTE has been derived from ABS Input-Output Tables 2012-13 and WA Treasury CPI 2021. Employment multipliers have been derived from ABS Input-Output Tables 2012-13.

Event Impact FTE uses an Output per FTE figure of $134,567, and an employment multiplier of 1.77. Accommodation Impact FTE uses an Output per FTE figure of $226,689, and an employment multiplier of 2.21. Trip Impact FTE uses an Output per FTE figure of $139,394, and an employment multiplier of 1.775. Organisation Expenditure FTE uses an Output per FTE figure of $134,567, and an employment multiplier of 1.75.

Mermaids — Photo: Rebecca Stone
Data and Insights by
Report prepared for

This report has been prepared by Nicole Tan Emery, Jack Midalia, Rosie Tooby and Jordan Gibbs of Culture Counts. The authors would like to thank all stakeholders and staff for their participation in this research.

Approved by: Jordan Gibbs.
Date of Approval: 26 April 2022


We respectfully acknowledge the Traditional Owners of Country throughout Australia and recognise the continuing connection to lands, waters and communities. We pay our respect to Aboriginal and Torres Strait Islander cultures, and to Elders past and present.