Contents
Executive Summary
The ‘What Gibbs?’ Project is an initiative of the City of Canning Safe Active Street that encourages the community to take ownership for shaping the ‘what’ of Gibbs Street.
The project sought to understand how the neighbourhood stories of Gibbs Street could contribute to a growing local vision for enhancing the area. Gibbs Street is the artery connecting important local destinations within the area - including open spaces, education, and transport hubs - and has potential for further connectivity.
In asking residents and community members alike 'what makes a great street?', the Council can consider the ways to deliver on this vision for Gibbs Street.
The City is excited about the opportunity to upgrade Gibbs Street in line with the local community’s vision for ‘what makes a great street?’. Building on community feedback received, the opportunities to ‘Gibbs back' and improve the street can be captured into four key areas. These include:

- Reduce the speed limit to improve street safety
- Reduce width of the road to create single lane slow-points
- Install traffic calming measures such as slow-points and raised platforms

- Create user friendly pedestrian crossings
- Improve path connections to local destinations
- Dual footpath connections
- Introduce on-street parking

- Additional tree planting and landscaping
- Flush kerb rain gardens
- Increase shaded thoroughfares between street and local parks
- Work together with residents to make verges more attractive and water wise

- Places for neighbours to gather
- Enhanced lighting
- Wayfinding
- Activation of the street (community led events) to nurture connections between people
- Enhance local identity through public art
Evaluation Methodology
The City of Canning used Culture Counts to conduct an evaluation of neighbourhood perceptions by surveying members of the community and those participating in 'What Gibbs?' activities. Surveys were delivered through intercept interviews, postcards with QR codes, and through the Your Say platform. In partnership with Culture Counts, this survey was designed and developed to evaluate the strategic goals and outcomes of the City of Canning
107 responses were collected from public attendees. 66 were collected In-Person. 32 were collected through QR codes. 9 were collected through Your Say.
Each survey contained a range of ‘dimension’ questions, asking members of the public about their experience of the street. These dimensions have been developed and tested in collaboration with industry, practitioners, and academics to measure the impact and value of arts and cultural events and activities.
Appropriate dimensions were chosen based on their alignment with the City of Canning Safe Active Street strategic objectives.
| Domain | Dimension | Dimension Statement |
|---|---|---|
| Cultural | Belonging | I feel like I belong to my neighbourhood |
| Social | Sense of Self | I feel like I can be myself in my neighbourhood |
| Quality | Satisfaction | I like living in my neighbourhood |
Dimensions are assessed on a Likert scale, in which respondents move a slider to a point that indicates whether they agree or disagree with the dimension statement. An example of a dimension question in the Culture Counts survey tool is presented below.

Engagement Plan
Through a range of community events and activities led by the What Gibbs Welcome Team, feedback about local stories and neighbourhood-building projects was gathered.
The engagement plan sought to program activities that celebrated the diversity of our community and provided opportunities for the neighbourhood to get together and nurture connections. These welcomed efforts had multiple outcomes, including breathing new life and vitality into the street through tree planting, and opportunities for seniors to stay physically active. The focus of the engagement plan on strengthening local community activity was embraced by the neighbourhood, and the success of the 'Walk/Bike/Scoot to School' demonstrated the willingness of the community to get involved in shaping the ‘what’ of Gibbs Street.
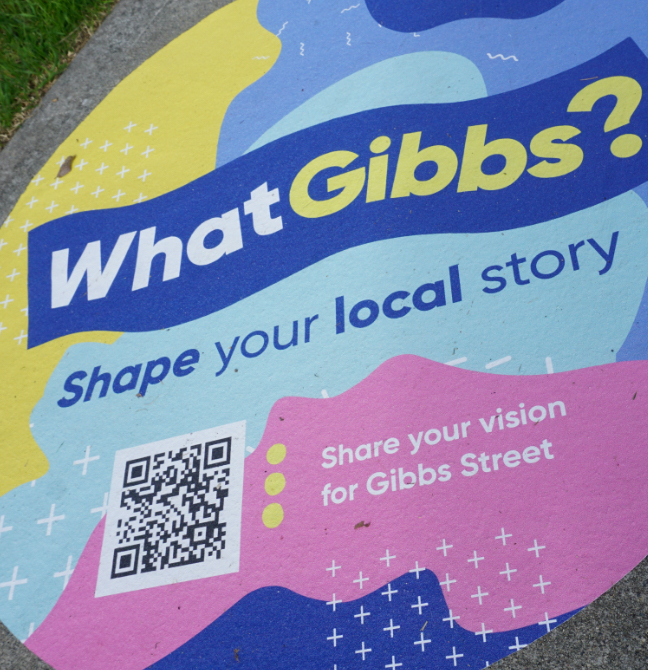
Other opportunities for neighbourhood-building and engagement included social media marketing, QR codes on postcards and community decals, as well as a general online survey that was available to the community through 'Your Say'.
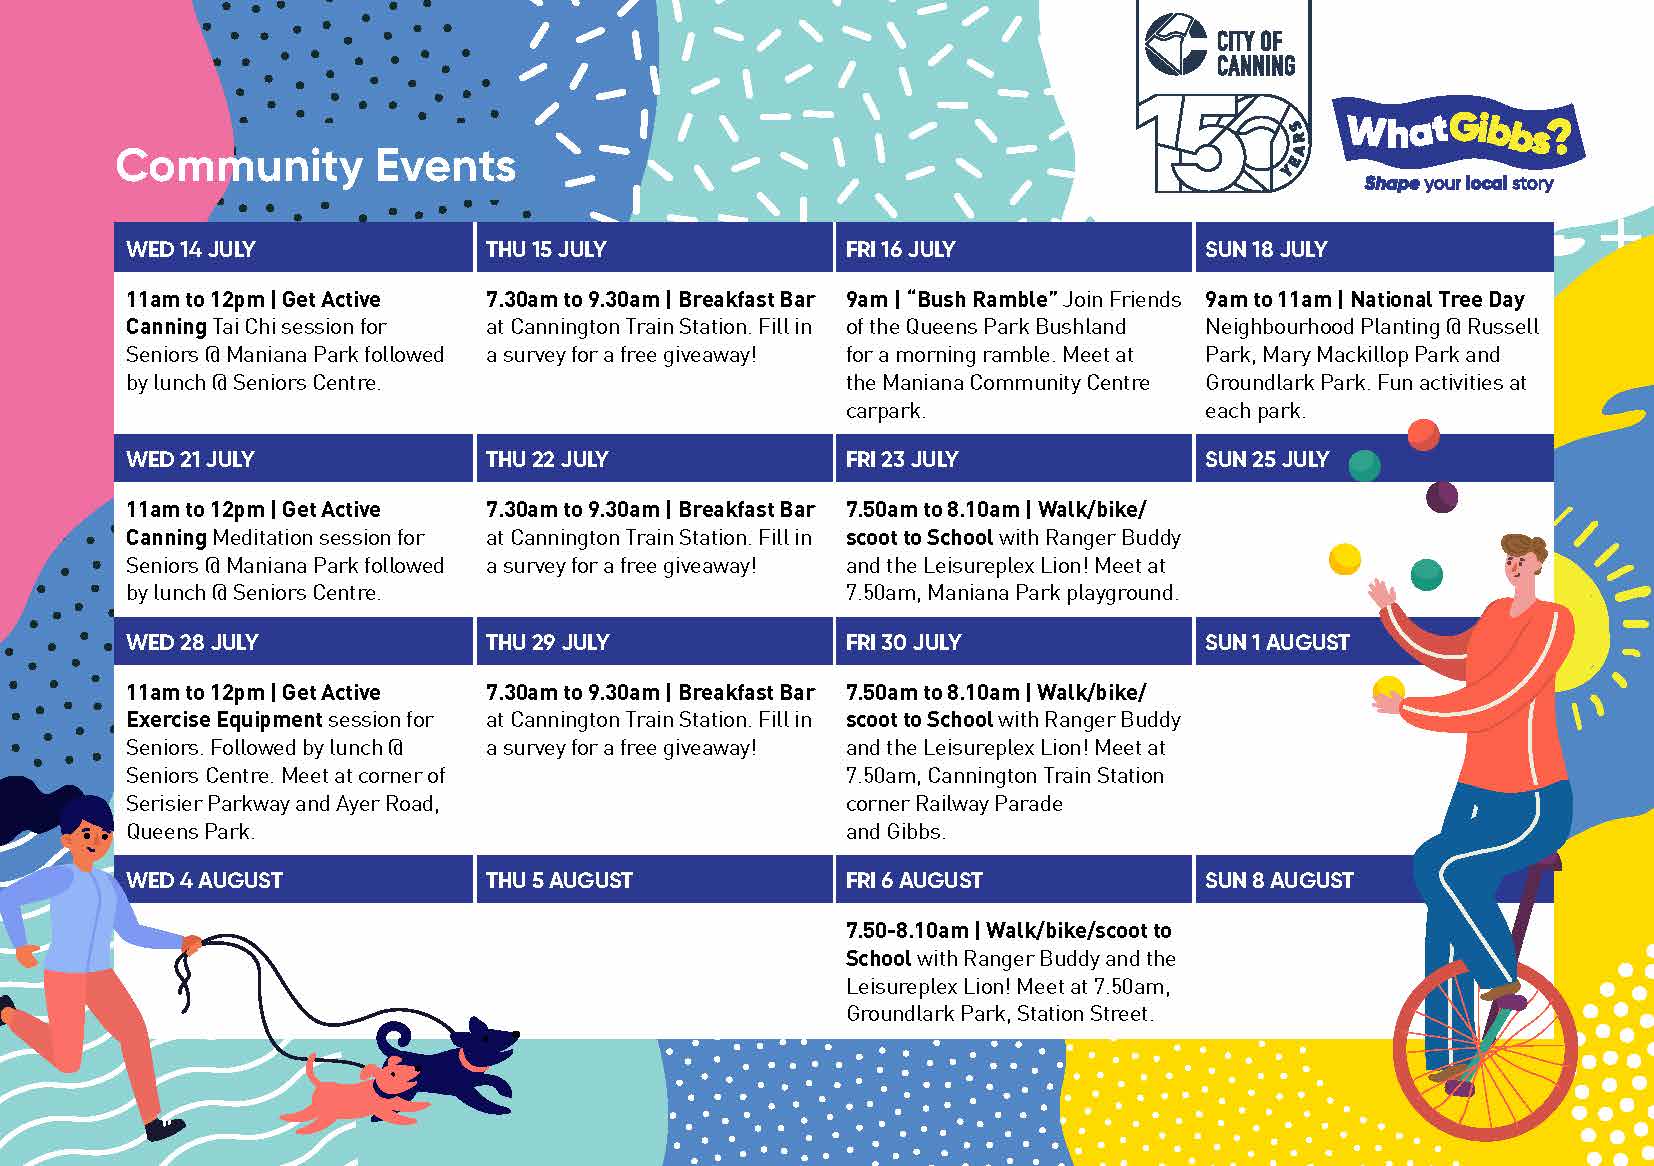
The following image represents a brochure of community activities that took place, between 14 July to 6 August 2021.
Source: City of Canning
Marketing Plan
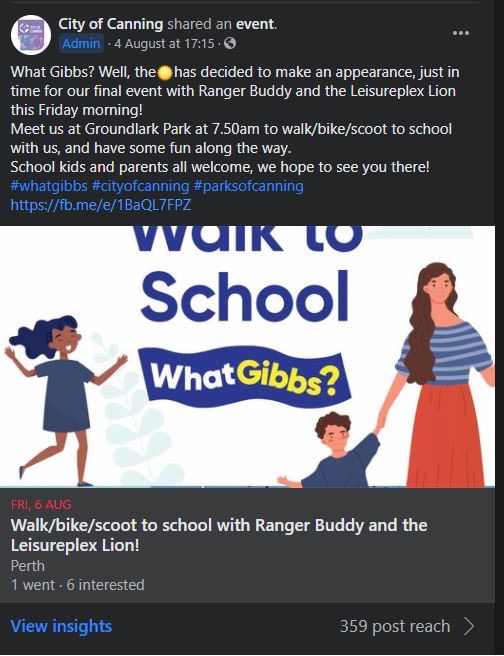
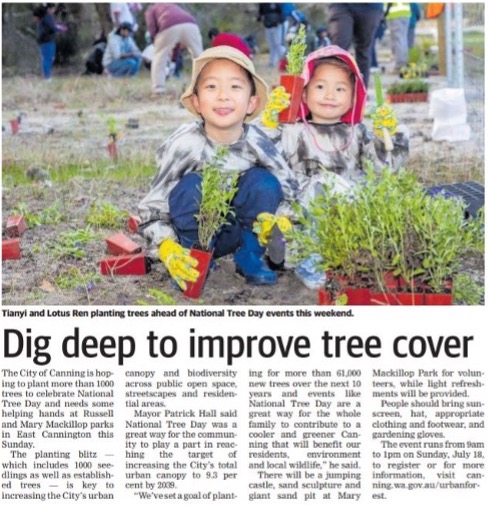
From 7 July to 4 August 2021, 10 posts were published on the City's Facebook page to promote the What Gibbs activity program. Five of these posts were 'boosted' to increase their exposure. Three articles were published in the traditional media outlet the Canning Gazette.
The following items are two examples of marketing engagement, with a table following that summarises the marketing engagement across all channels used.
| CHANNEL | # OF POSTS | REACH |
|---|---|---|
| 10 | 12,443 | |
| Facebook (Paid) | 5 | 5,783 |
| Traditional | 3 | 48,162 |
| TOTAL | 13 | 60,605 |
Source: City of Canning.
Note: Facebook stats includes Facebook (Paid) results and are therefore not summed in total results.
Respondent Profile
Demographics
Survey respondents were asked to provide their current living location. This data identifies the demographic sample of people who responded to the survey and took part in the event. It enables data to be matched to the wider population and responses to be filtered to understand differences in demographics.
The following charts show the proportion of survey responses captured for respondents' identified living location and whether they currently live on Gibbs Street or not.
Insights
The largest age group of respondents live in the City of Canning (89%). 10% of respondents live in the Perth Metro Area and less than %1 of respondents live elsewhere in WA. More than half (53%) of respondents live on Gibbs street.
Participation
Respondents were asked about their participation in community activities and various community groups. Category responses were sourced from the Australian Bureau of Statistics (ABS) General Social Survey for benchmarking purposes. This allows responses to be compared to the Australian average for community participation types.
Respondents were asked whether they had engaged with a community group in the last 12 months, based on the group's primary focus (i.e. social group, political group, etc.) Respondents were also asked if they had participated in a selection of activities in the last month, focused around the kind of activity type (e.g. sports, family, etc.)
Results for these questions are shown in the charts below, accompanied by the ABS benchmark for the 2020 General Social Survey for comparison.
Insights
'Social Groups' (46%) received the highest level of involvement in the last 12 months from survey respondents. This was followed by 'Community Support Group' (21%) and 'Civic/Political Groups' (7%). The results did not meet the ABS 2020 Benchmarks.
The respondents to the ‘What Gibbs?’ survey exceeded the ABS 2020 benchmarks for nine out of 12 activities and groups they had participated in the last month. 'Sport/Physical Recreation' (43%), 'Community/Ethnic Group' (42%), and 'Education/Training' (27%) had the highest levels of participation.'International Aid/Development' (5%) and 'Emergency Services' (3%) received the lowest levels of participation.
Visitation
Respondents were asked if they had visited any of the following locations in the local community in the last month. Category responses were generated by City of Canning staff to create a representative list of major community locations.
Respondents were also provided an 'other' option that they could provide their own custom response for, in addition to the prompted list. Results for this question and a selection of commonly provided 'other' options are provided below.
Have you visited any of the following places on Gibbs Street in the last month? (Other)
-
Cunnington Park (32%)
-
Carousel Shopping Centre (29%)
-
Mills Park (14%)
-
Leisureplex (14%)
Insights
Cannington Train Station (58%) and Maniana Park (55%) were the most visited places on Gibbs Street in the last month. This was followed by Mary Mackillop Park (30%) and Gibbs Street Primary (28%). Maniana Park Community Facility (8%) and Scouts WA (3%) were the least frequent places visited by respondents in the last month.
Of the options that were provided in the free-text field, Cunnington Park was the most frequently cited option, with 32% of 'other' respondents writing this location. Mills Park and the Leisureplex were selected by 14% of 'other' respondents, respectively. 11% of 'other' respondents listed Carousel. It is noted that these locations are not on Gibbs Street, but were of importance enough for respondents to answer.
Community Stories
Reflections
Respondents were asked to provide comments regarding their reflection of Gibbs Street and share their thoughts on what makes a great street.
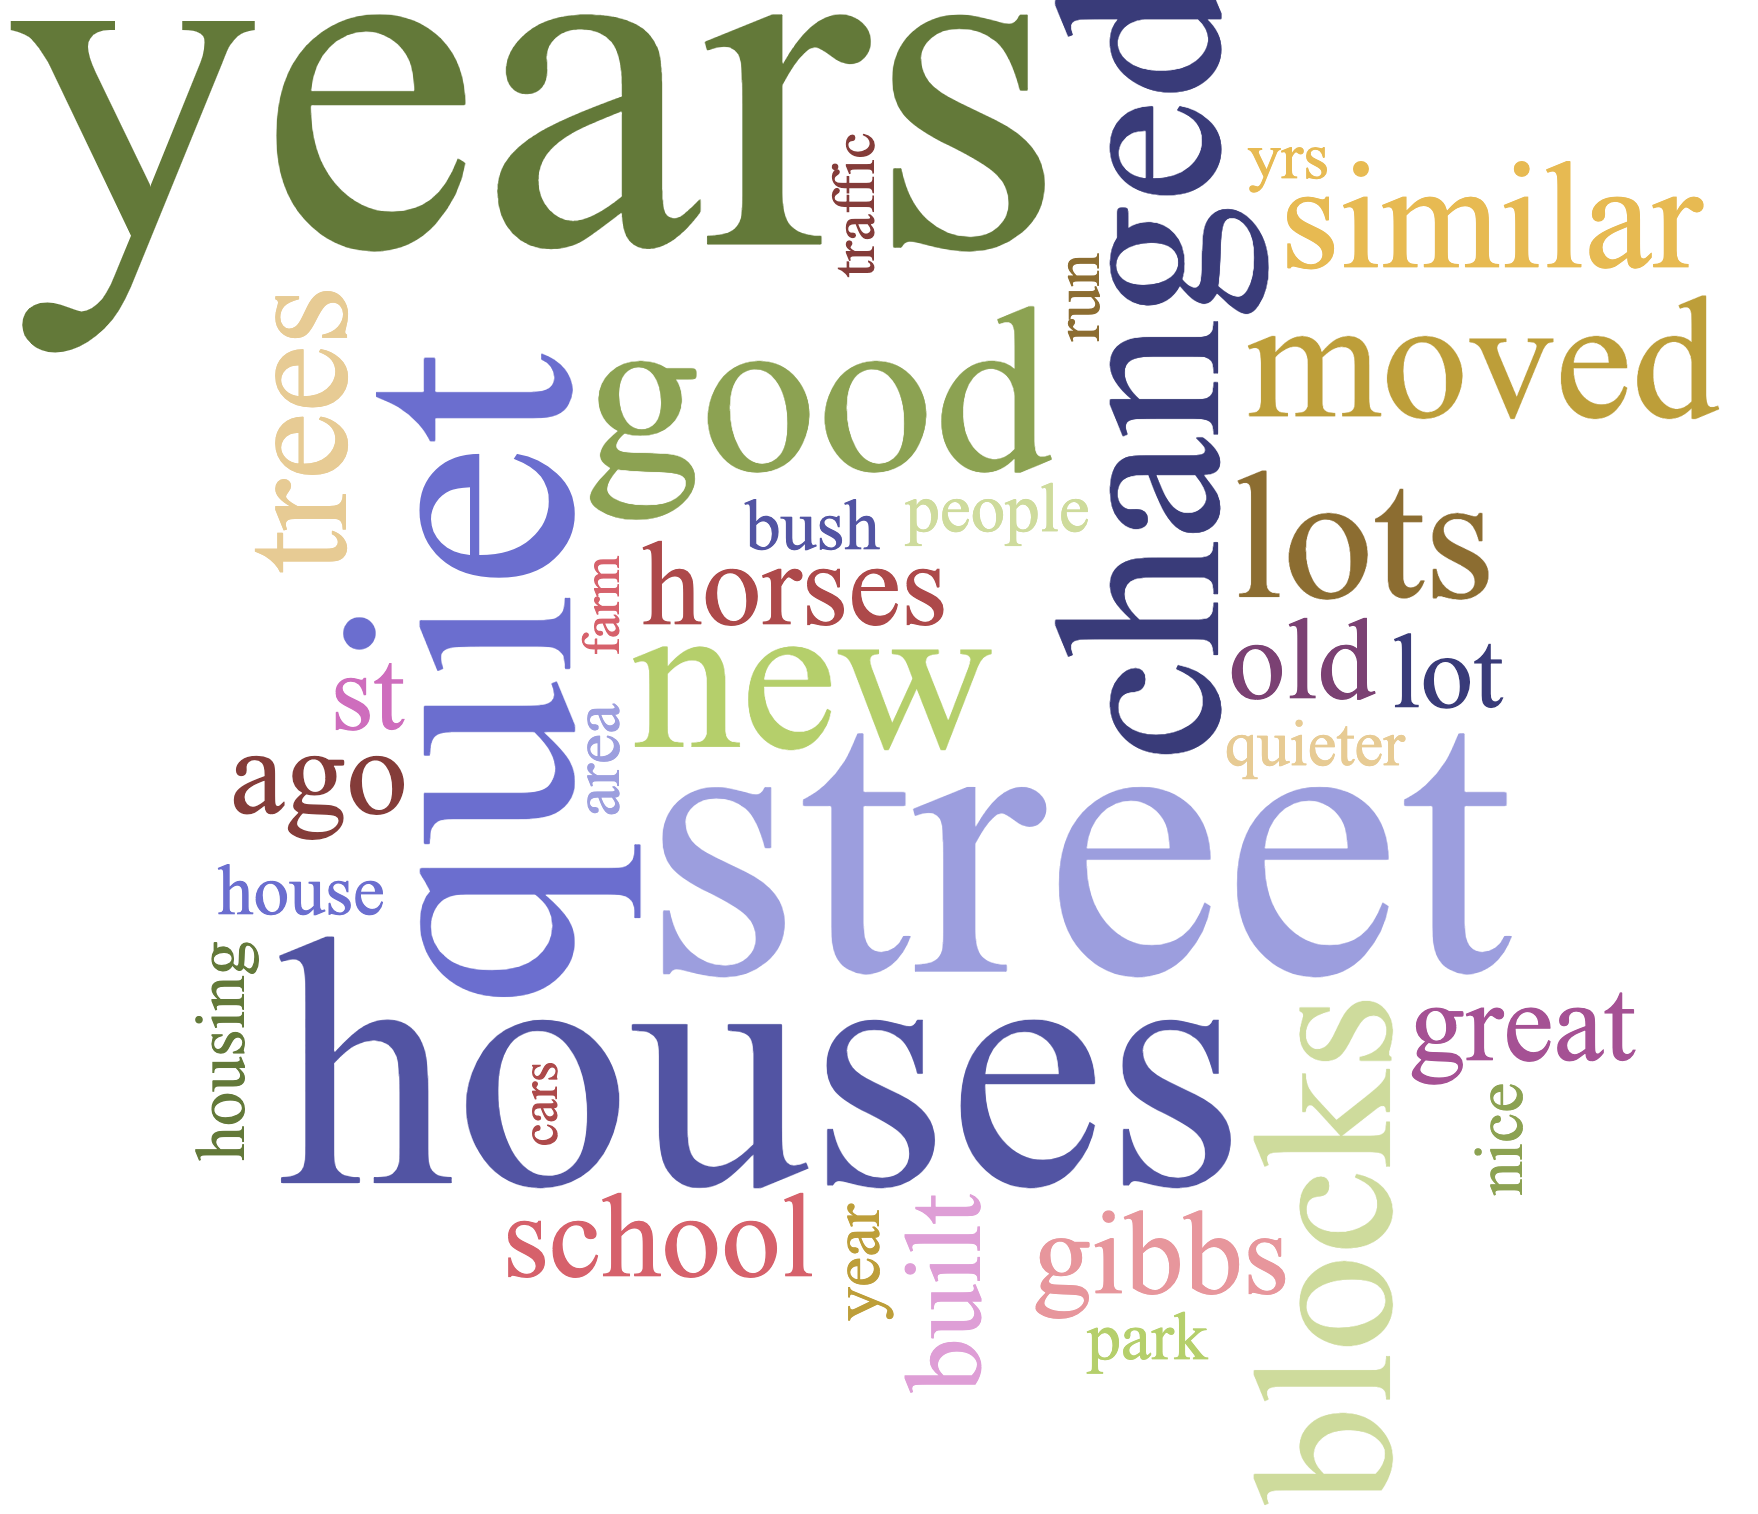
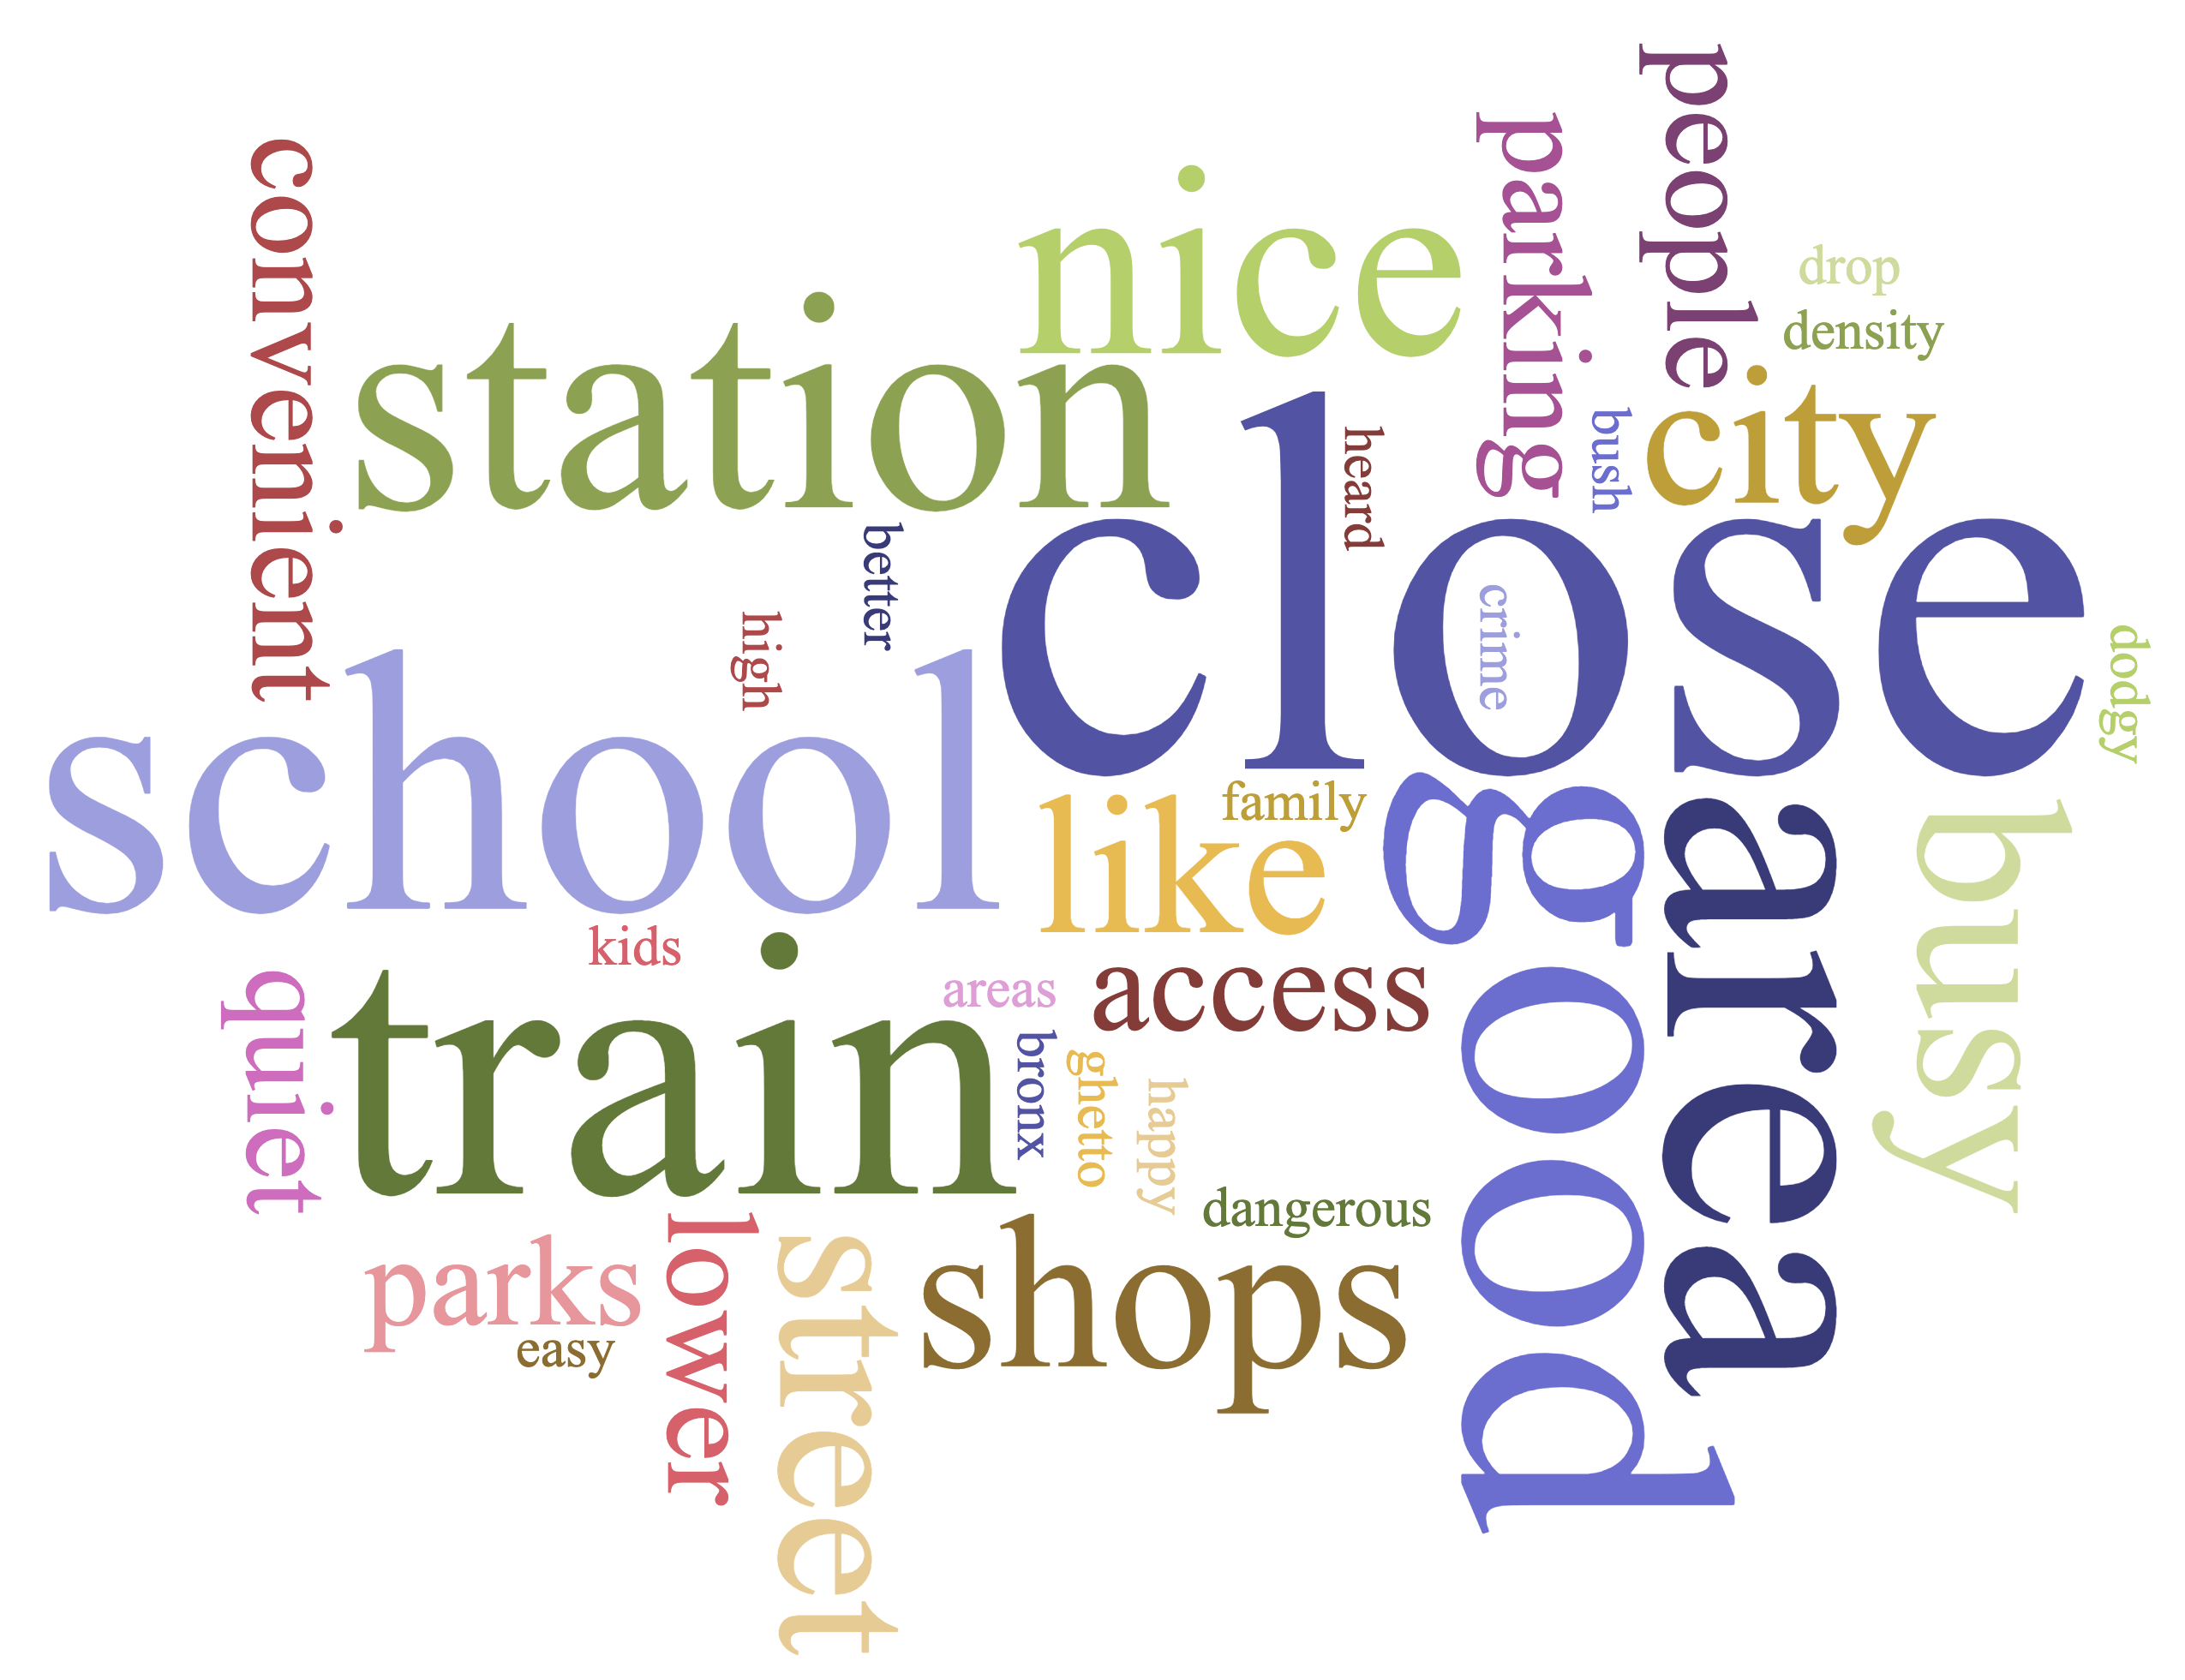
A summary of these terms and a selection of this feedback is presented below.
What was Gibbs Street like when you first moved here?
-
10 years ago it was very similar, the parks have not been upgraded
-
Quiet and a small community
-
Gibbs Street was quieter when I first moved here. The housing blocks were larger and there were fewer people. Residents had horses on their land and would exercise them in the street.
-
Rural, but now it has become too crowded
-
I've only been here 6 years, so it has not changed significantly
-
Different demographic, know everyone on the street, kids playing in the street, ride their bikes to the primary school
-
Quieter. Lived 12 years. Less cars. Less units.
What words do people who did not live there use to describe Gibbs Street?
-
Multicultural, high density, not enough parking for density of units
-
Up and coming, next generation
-
Close to shopping, train, schools, doctors, central, nice people
-
Terrible. Lots of crime. Has changed over the years. Convenient. Close to City, shops. Parks
-
Dodgy first impression
-
Mix of modern and old together, subdividing, affordable, investors, govt housing
Opportunities
Respondents were asked to provide comments regarding opportunities for Gibbs Street and how others who did not live there might describe it. Feedback was analysed with top terms highlighted.
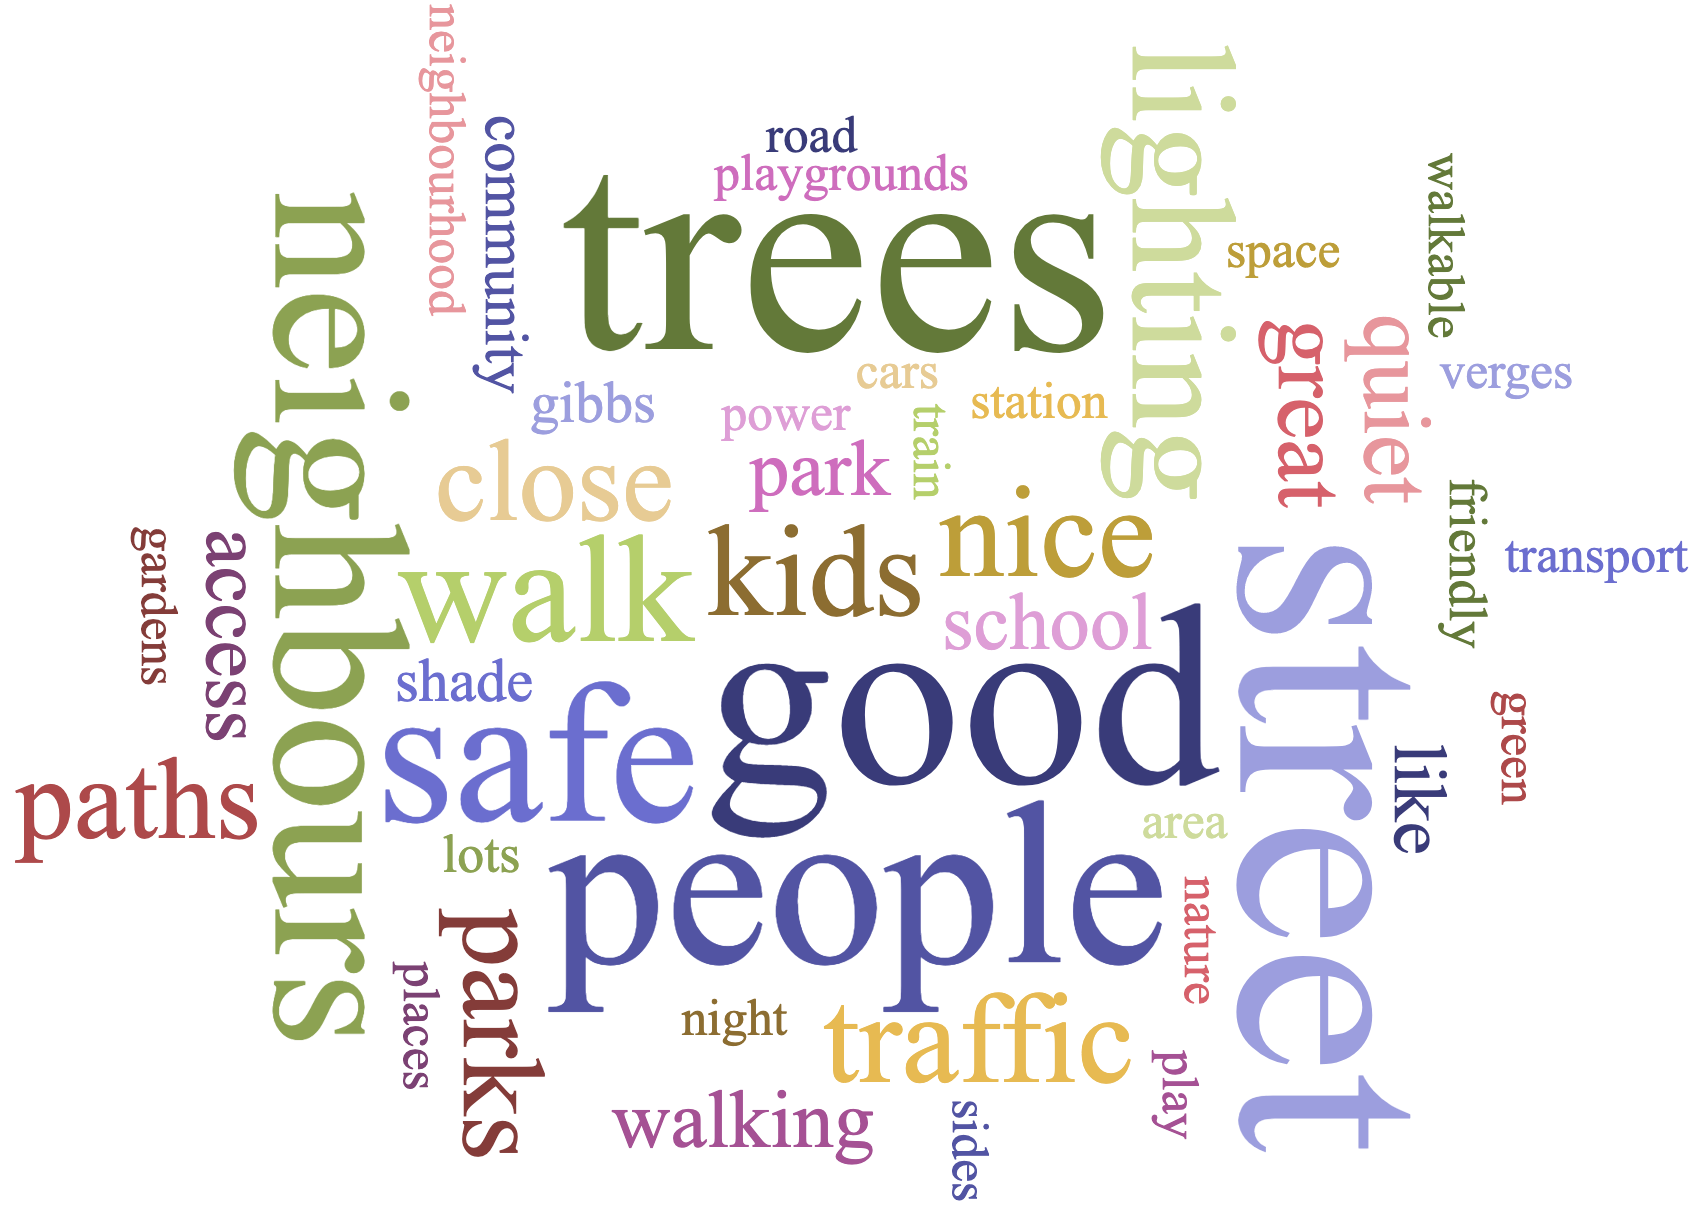
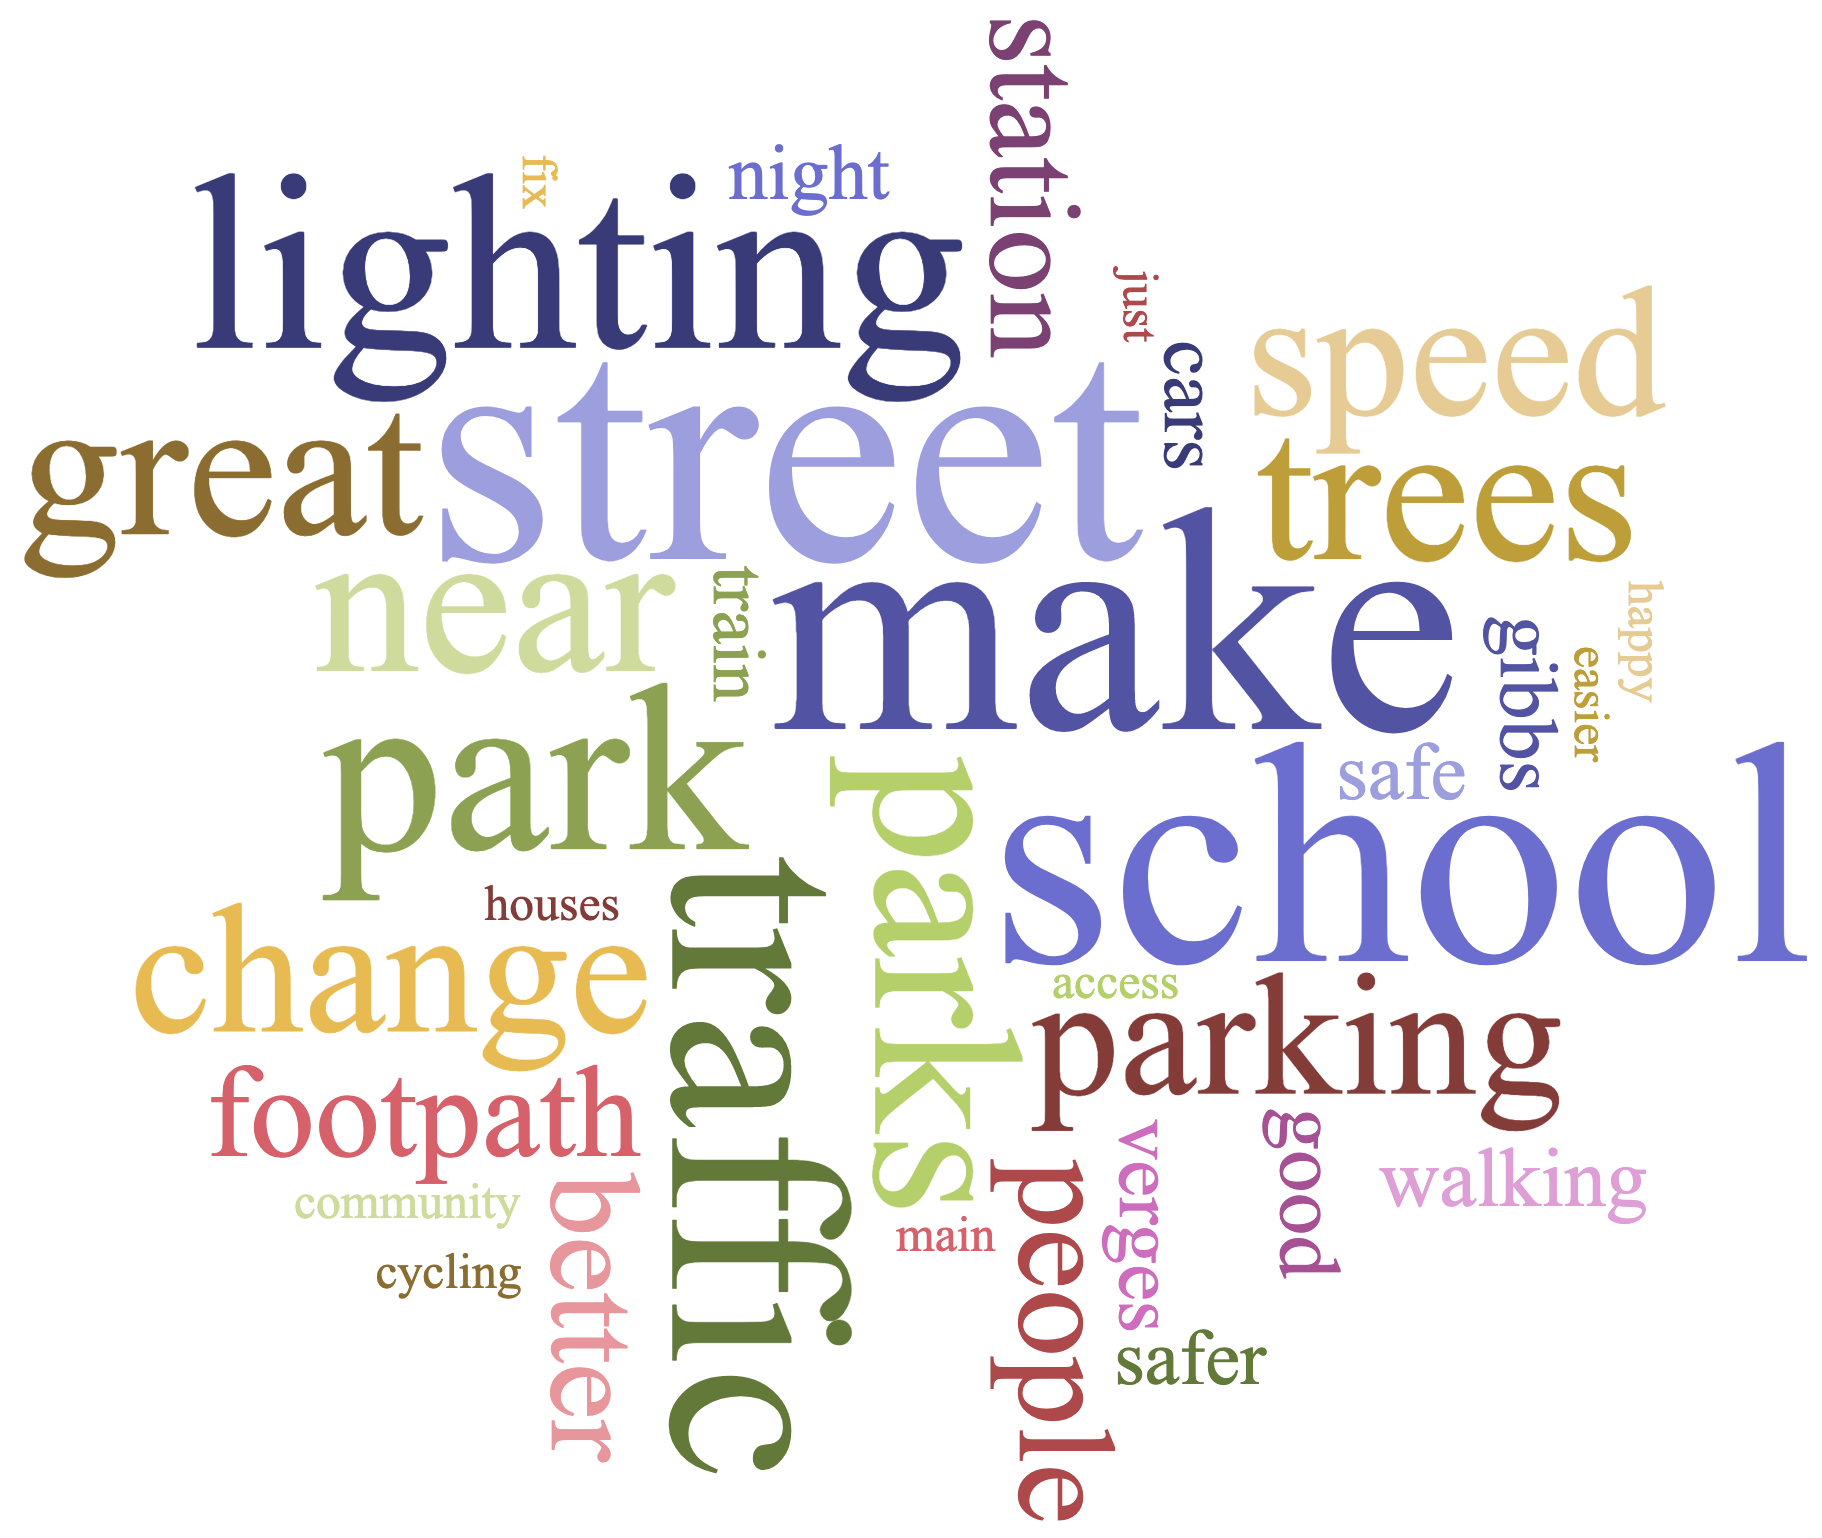
A summary of these terms and a selection of this feedback is presented below.
What makes a great street?
| Ref # | Topic Name | % of Comments |
|---|---|---|
| 1 | Community | 14% |
| 2 | Convenience | 9% |
| 3 | Infrastructure | 9% |
| 4 | Environment | 9% |
| 5 | Safety | 7% |
| 6 | Quiet | 3% |
-
Walkable, abundant trees to provide shade/cover, mix of houses/shops/parks
-
Enough facilities nearby
-
Community involvement. Knowing your neighbours. Less cars. Kids riding on their bikes and scooters. People using the park
-
Safe street. Not afraid at night. Nice to walk around.
-
Nice landscaping, good foot paths, excellent night-time lighting
-
people-focused design, a balance between natural environment and built environment, universal access, design solution that meet the needs of the users
-
Quiet, not noisy, safe, see around corners
If you could change one thing about Gibbs Street what would you change?
| Ref # | Topic Name | % of Comments |
|---|---|---|
| 1 | Parks and Trees | 19% |
| 2 | Traffic | 17% |
| 3 | Footpaths and Pedestrian Safety | 14% |
| 4 | Lighting | 11% |
| 5 | Parking | 8% |
-
Make it easier to get across the railway line
-
Aesthetically just give it a revamp, redo the footpath as a main point, I feel like that would help give the street a facelift.
-
Make people care about each other
-
More activities for young kids at parks
-
Traffic. Slow speed of traffic.
-
People to come together, including people from overseas. Family oriented.
Community Perceptions
Outcome Averages
Survey respondents moved a slider to indicate whether they agreed or disagreed with the included dimension statements in relation to the street. The following charts contain the response data for 'public' responses, showing the average result for each dimension.
The Culture Counts platform provides various methods to capture survey responses at a minimal marginal cost. Achieving larger samples enables organisations to be more confident about the average results and that opinions of the survey respondents are representative of all attendees. The accompanying margin of error chart shows the expected differences for the associated dimension results calculated at a 95% confidence level.
The What Gibbs survey used three dimensions to track community perceptions and outcomes. These dimensions were:
-
Belonging: I feel like I belong to my neighbourhood
-
Sense of Self: I feel like I can be myself in my neighbourhood
-
Satisfaction: I like living in my neighbourhood
The first chart below shows the average result for these dimensions. The second chart shows the interquartile range (IQR) of dimension responses. This chart represents the areas on the slider where most responses typically fell and the median result for each dimension (i.e. the most common response). Smaller ranges indicate greater agreement between respondents, whereas larger ranges indicate less agreement.
Insights
All dimensions measured achieved positive results. 'Satisfaction' (80/100) scored the highest followed by 'Sense of Self' (78/100) and 'Belonging' (73/100). This indicates that respondents were likely to agree that What Gibbs made them feel like they belonged to their neighbourhood, they feel like they can be themselves in their neighbourhood, and they like living in their neighbourhood. 'Belonging' received the largest inter-quartile range indicating the results for this dimension was the most varied.
At a 95% confidence level, the margin of error for dimensions ranged from 4.3% to 5%. This means that we can be 95% confident that if we surveyed the entire community population, the average outcome for 'Sense of Self' would fall within 4.23% of the average generated by the sample.
Correlations
Respondents were asked about their community participation and engagement. These are common 'factors' that can be tested against results of the ‘dimensions’ questions to identify and understand any statistically-significant differences in results.
An analysis is run on the 'dependant variables' - in this case, these are the results for the dimensions. Results are filtered by the different factors - the larger the difference in the result, the more influence this factor has on the result. This information can be used to identify any correlating factors that may be of interest to public policy purposes.
The following factors were tested:
-
Residence: Do you live on Gibbs Street?
-
Involvement: In the last 12 months, have you been actively involved in any of the following?
-
Visited: Have you visited any of the following places on Gibbs Street in the last month?
The following charts highlight the results and factors that were explored.
Insights
Respondents who live on Gibbs Street scored higher for 'Belonging' (+6/100) and 'Satisfaction' (+2/100) dimensions while respondents who do not live on Gibbs street scored the highest for 'Sense of Self' (+1/100).
Respondents who had been involved in Social Groups in the last 12 months had the highest results across all dimensions. Those involved in Civic/Political Groups and Community Support groups in the last year scored similarly for 'Sense of Self' (69/100 and 70/100 respectively) and 'Satisfaction' (69/100 and 67/100, respectively). 'Belonging' had the most varied results with 76/100 for Community Support Groups and 71/100 for Civic/Political groups.
Respondents who had visited Gibbs Street Primary in the last month scored the highest average score all dimensions, though was only the highest result for 'Satisfaction'. Those who visited Gibbs Street Primary, Cannington Train Station, and Mary Mackillop Park also scored a very positive result across the three dimensions. Visitors of Queens Park Regional Reserve trended the lowest scores across the dimensions.
Comments and Feedback
Sentiment Analysis
Respondents were asked to leave any additional feedback about their experience of Gibbs Street or the community engagement program. This feedback has been classified into positive, neutral or negative categories, with the percentage of each of the sentiment types presented in the following chart.
General Feedback
Feedback helps organisations understand where the value of visitor experiences lies and how they can be improved and strengthened in the future. A selection of comments has been highlighted underneath.
-
Good area
-
Thank you giving the opportunity to give back to the community
-
Pretty happy with the neighbourhood
-
Looking forward to seeing some improvements
-
Often times it feels like you have to leave Queens Park in order to do "anything", it would be great to have more reasons to interact with people in the suburb
-
Art work around the area would be cool and cleaning up over grown edges which have common borders with city would help. Regular control of caltrop.
-
Don't want rubbish left on verges or leaving bins out.
-
Bad neighbour, needs visit from Rangers

This report has been prepared by Jordan Gibbs, Jack Midalia and Nicole Tan Emery of Culture Counts. The authors would like to thank all stakeholders and staff for their participation in this research.
Approved by: Jordan Gibbs.
Date of Approval: 12 August 2021
We respectfully acknowledge the Traditional Owners of Country throughout Australia and recognise the continuing connection to lands, waters, and communities. We pay our respect to Aboriginal and Torres Strait Islander cultures, and to Elders past and present.
