30k
Members
2500
Respondents
12
Quality Metrics
Over a two-week period, Culture Counts surveyed library members to find out what they thought of their local library. 2,500 public responses were recorded via intercept interviews at the library, self-completion on library computers, and a mail out to the membership database.
Each survey contained 12 ‘dimension’ questions, asking members about their experience using the library. Developed in consultation with the sector, these quality dimensions provide insight into the value the library generates for its users.
The majority of people approached were happy to participate, as they found tablet surveys less intimidating than their paper counterparts. Many respondents also commented that the survey was intuitive and easy to complete.
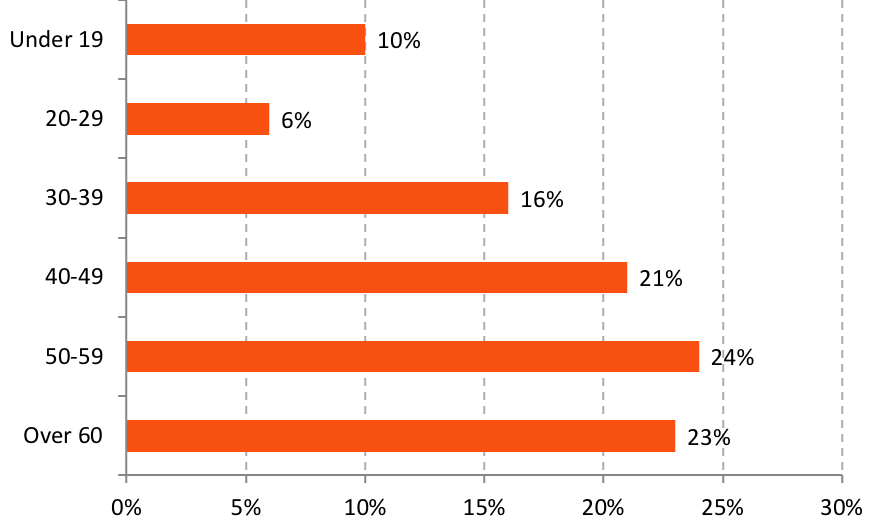
Survey respondents were asked to provide their age, gender, and which library branch they used most often at the end of the survey. This enables data to be matched to the wider population and responses to be filtered to understand differences in demographics. The charts show the proportion of public survey responses captured for age and gender, and the library branch respondents used most often.

The majority of respondents were female (68%), with 29% identifying as male and 3% as an alternative gender. Responses were captured via intercept interviews at the libraries, and interviewers are encouraged to approach people of all different demographics, so it is assumed that the sample is representative of the people who attended.
The largest proportion of respondents were in the 50-59 age cohort (24%), followed by Over 60 years old (23%). There were a mix of other age groups present, indicating that the libraries had broad appeal for all ages. The least represented group were those between 20 and 29.
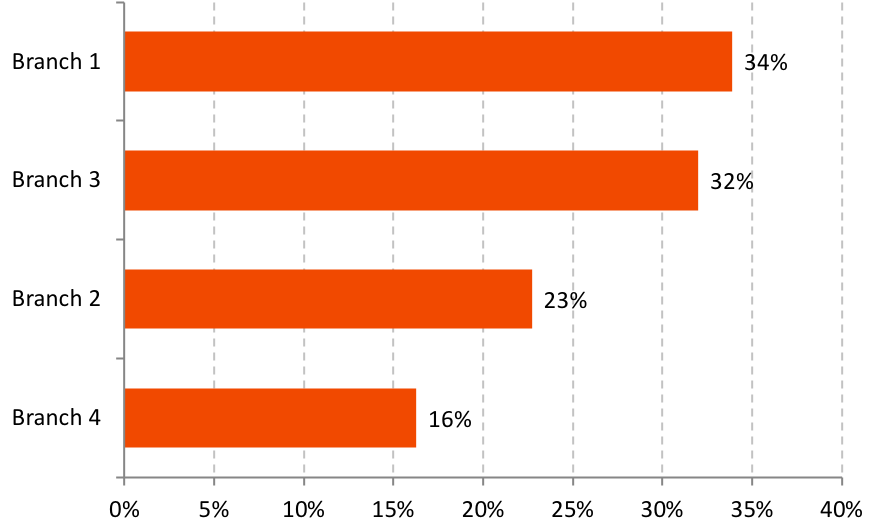
The majority of respondents indicated that they used the Branch 1 library most often (34%), however, respondents were fairly evenly distributed across all four library branches.
The surveys contained additional custom questions regarding library membership and use. Respondents were asked if in the past 12 months they had:
This chart identifies the percentage of respondents that have and haven’t attended events, used facilities and accessed online services.
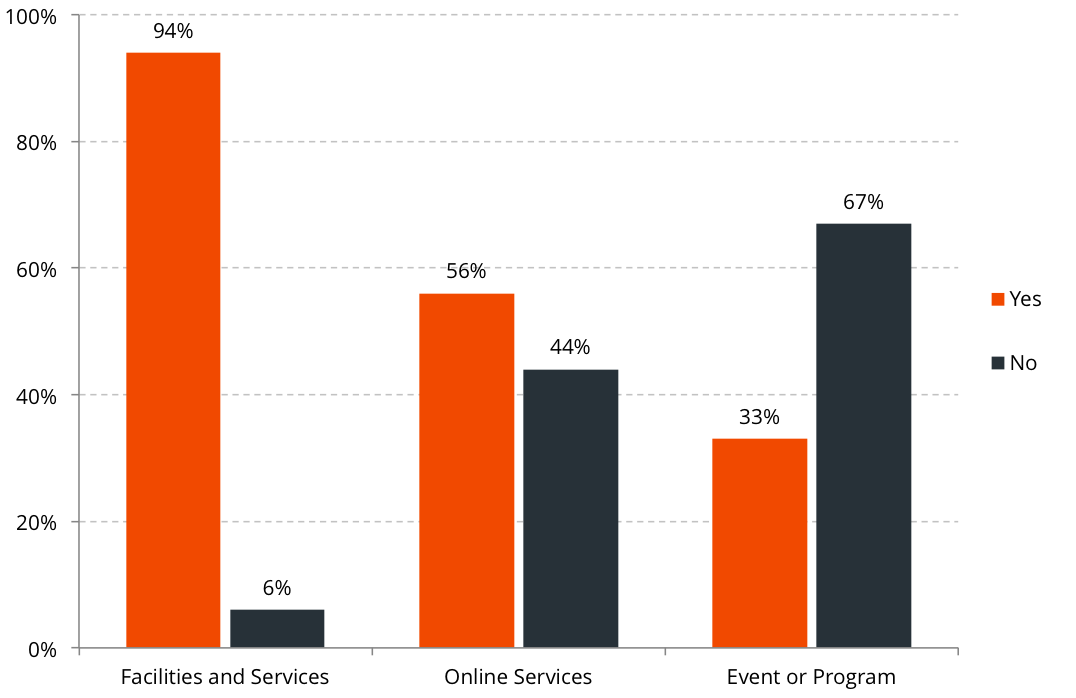
The majority of respondents use facilities and services at the library (94%), while 33% have attended an event or program in the last 12 months. Just over half of respondents have used online facilities and services (56%).
Respondents were asked what brought them to the library. This allows the library to examine the main service areas that members of the public think are most useful and revelant.
This chart identifies the percentage of respondents that answered each option.
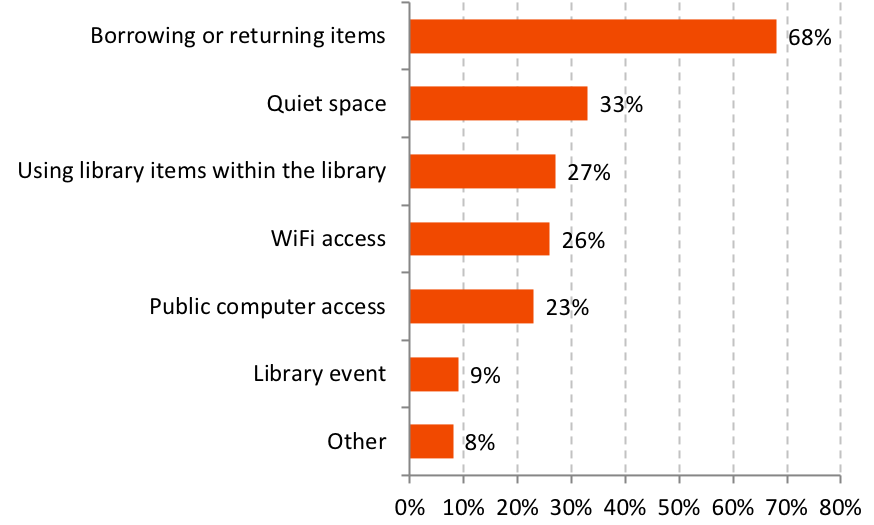
The primary reason respondents used the library was borrowing or returning items (68%), which was over double the next highest categories — using the library as a quiet space (33%), and using items within the library (27%), . Less than one quarter of respondents indicated that they used the library for WiFi access (24%). This highlights that respondents typically used the library for reasons associated with a more "traditional" approach, whereas accessing the library for an event or for access to technology (WiFi, computers) were less common.
Survey respondents moved a slider to indicate whether they agreed or disagreed with the dimension statement using a likert scale. This chart contains data for all public responses, showing the average score and the percentage of people that agreed or disagreed with each of the statements.
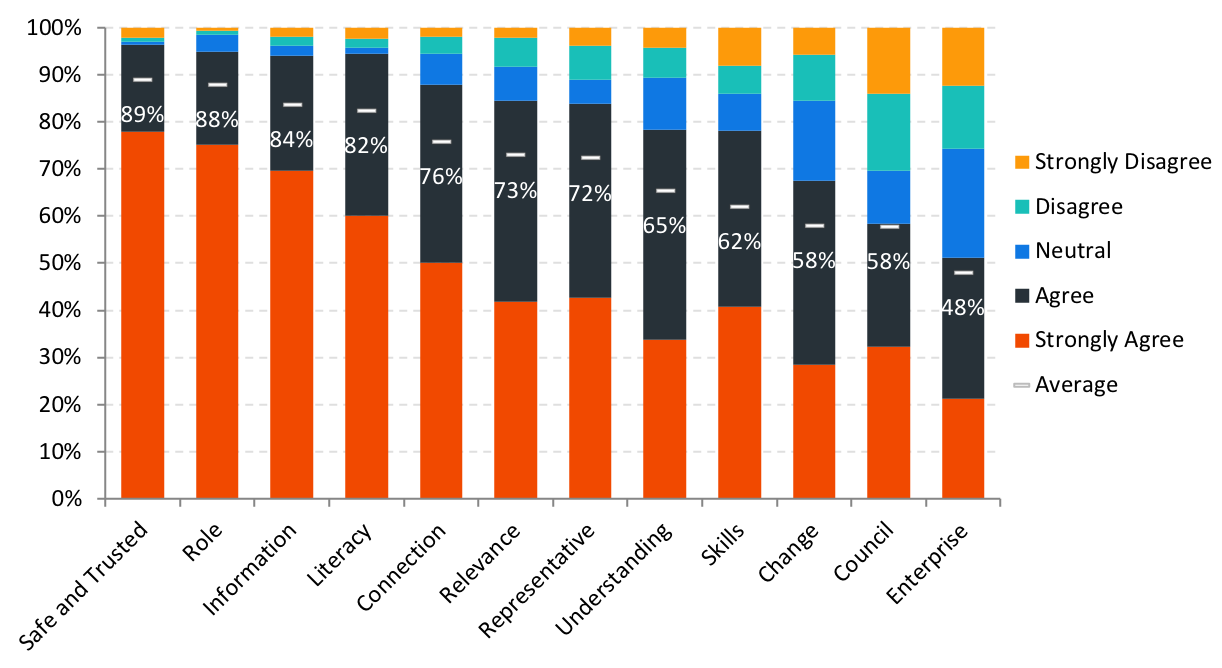
The majority of respondents agreed or strongly agreed with each of the 12 dimensions, with all but one (Enterprise; 48%) receiving average scores above 50%. People felt safe and welcome at the library (Safe and Trusted; 89%), had met their informational and reading needs (Information; 84%), and that the library had encouraged them to read more (Literacy; 82%). Respondents were less positive that the library encouraged them to make changes in their lives (Change; 58%), that it helped them to understand the role of the Council (Council; 58%), or that it helped their business and employment opportunities (Enterprise; 48%).
Despite this, people think that the library is an important part of the place where they live, with 95% of respondents either agreeing or strongly agreeing with the ‘Role’ dimension. Respondents aged 50-59 years old gave higher scores for almost all dimensions.
Survey respondents were asked to indicate how satisfied they were with library service overall, with a choice of five options - Very good, good, satisfactory, poor, and very poor.
This graph shows the percentage of respondents that chose each option.
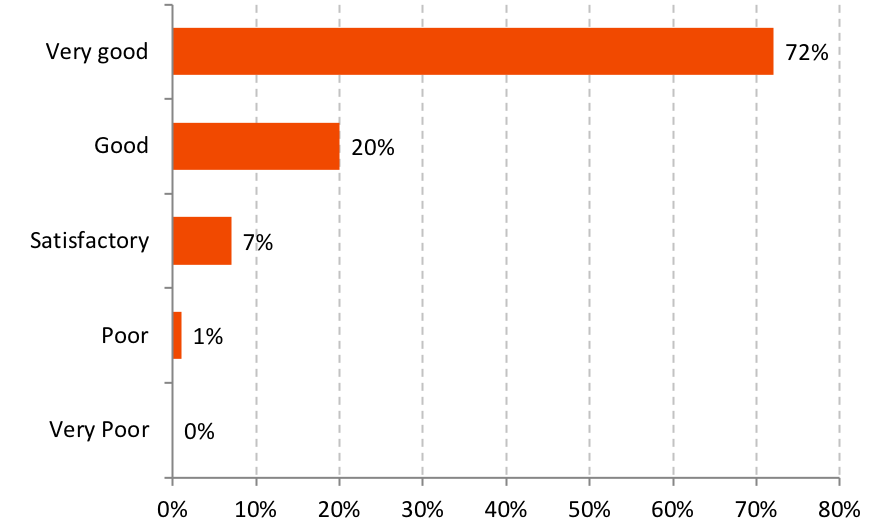
92% of respondents found their library to be better than satisfactory, with 72% rating it as very good, and 20% rating it as good. Only 1% of respondents thought their library was poor or very poor, indicating that overall respondents were very satisfied with the library service.
The library service has four different library branches - Branch 1, Branch 2, Branch 3, and Branch 4. At the start of each survey, respondents were asked to nominate which library they used most often - allowing the scores for each branch to be compared.
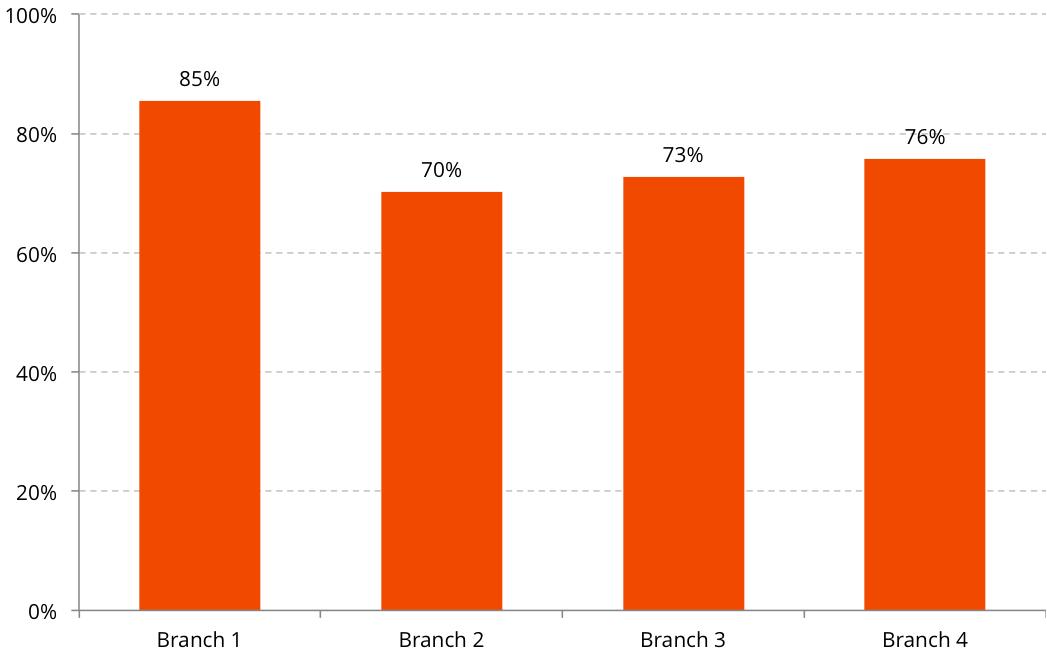
The graphs below show the dimension scores, and the average dimension scores overall for each branch.
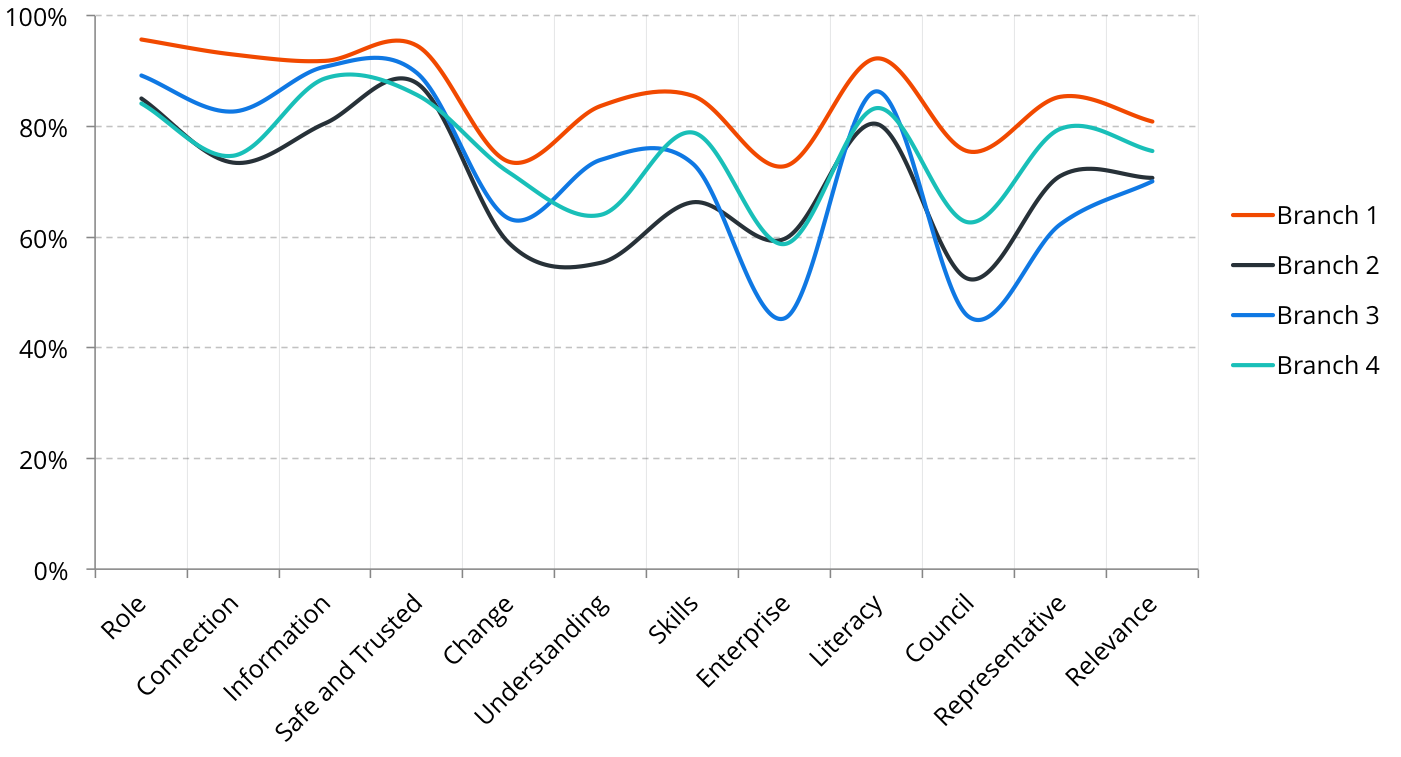
Branch 1 had the highest dimension scores for all twelve dimensions. The other library branches had very similar dimension trends except for Branch 2, which scored below trend for Understanding and Skills but above trend for Enterprise; Branch 3, which scored below trend for Enterprise and Council; and Branch 4, which scored below trend for Understanding but above trend for Skills.
Overall, scores were fairly even across all branches, with most falling within a few percentage points of one another with the exception of Branch 1 scoring 9% higher than any other branch overall. This could be a fantastic opportunity for Branch 1 to share lessons learned or other best practice techniques that could help staff at other branches. The lowest score was for Branch 2 at 70% — indicating it may require additional resources or support to improve.
Every respondent was asked to provide their age, gender and postcode at the end of the survey. This enables scores to be filtered to understand differences in demographics.
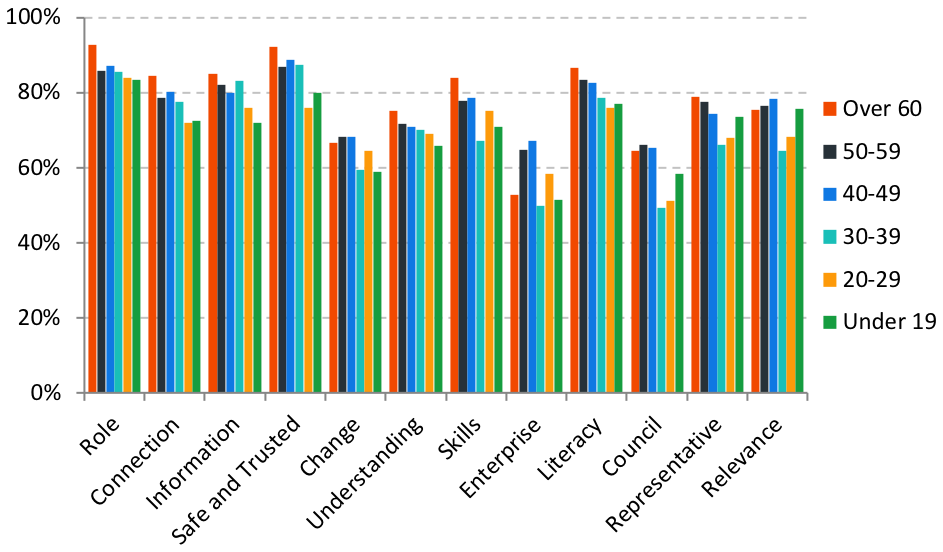
These charts show average scores for each of the dimensions based on the gender that each respondent most closely identifies with ‐ male, female or in another way — and based on age cohort. Groups with a low number of responses have been faded out.
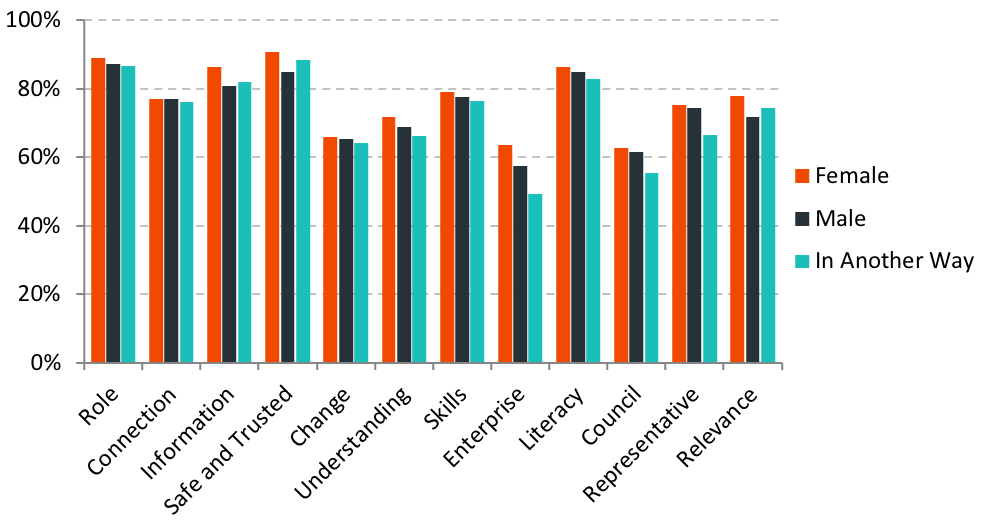
Female respondents gave higher average scores than males for most dimensions, while scoring similarly for others like Connection or Change - in which both genders scored similarly. The largest difference in scores was for Enterprise, where Females scored 6% higher than males on average, suggesting that these services had a greater impact on females than it did on males. Those who described their gender in another way generally scored the lowest for all dimensions with the exception of Information, and Safe and Trusted, highlighting the role of the library in helping minority groups feel safe and welcome, and in finding information.
Older respondents tended to score higher for many of the dimensions, including Role, Connection, Information, Safe and Trusted, Skills, and Literacy, particularly for those aged over 60. Enterprise, while typically scoring quite low, was rated highly by those between 40 and 59, and those between 20 and 29 - indicating that the services offered by the libraries were more impactful throughout these age groups when it came to helping with their business activity.
Culture Counts dimensions are standardised globally, and can therefore be used for comparisons. Culture Counts uses anonymous aggregate data to calculate relevant benchmarks so that organisations can see how they are performing relative to the sector or other key organisations.
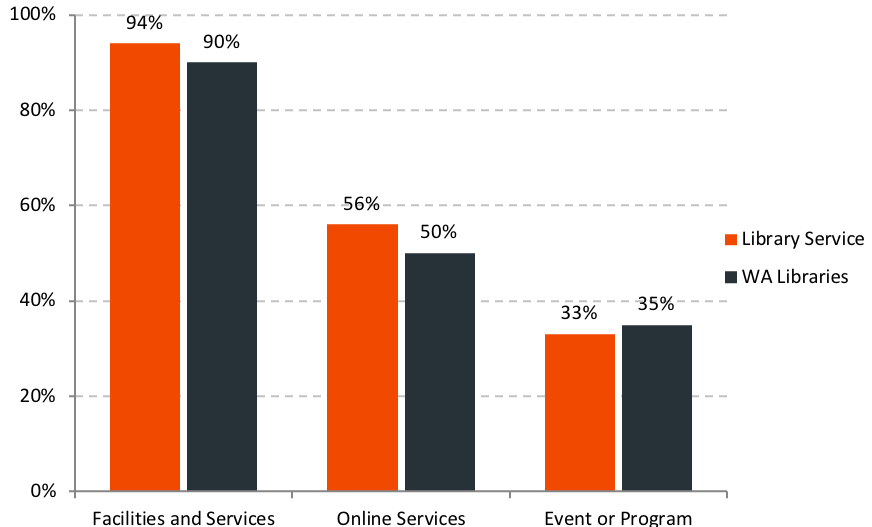
The graphs below show the library service's dimension scores and the percentage of respondents who answered "Yes" to using particular services, and how they compare with other West Australian libraries.
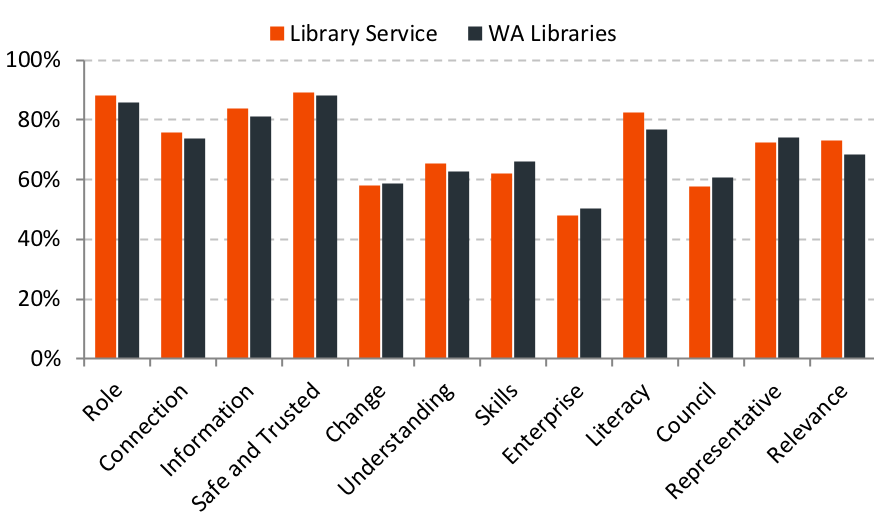
The library service scored higher than the average WA library for seven of the 12 dimensions. They generally outperformed the benchmark in areas which libraries are traditionally known for, such as having a strong role in the community (Role; +2%) providing relevant information (Information; +2%), or encouraging people to read more (Literacy; +6%). The areas in which it scored below benchmark were Change (-1%), Skills (-4%), Enterprise (-2%), Council (-3%), and Representative (-1%).
The library service had a very similar utilisation of services when compared to the library benchmark. The slightly lower percentage of members attending events or programs could help illustrate why the library service scored lower in practical areas such as Skills and Enterprise.
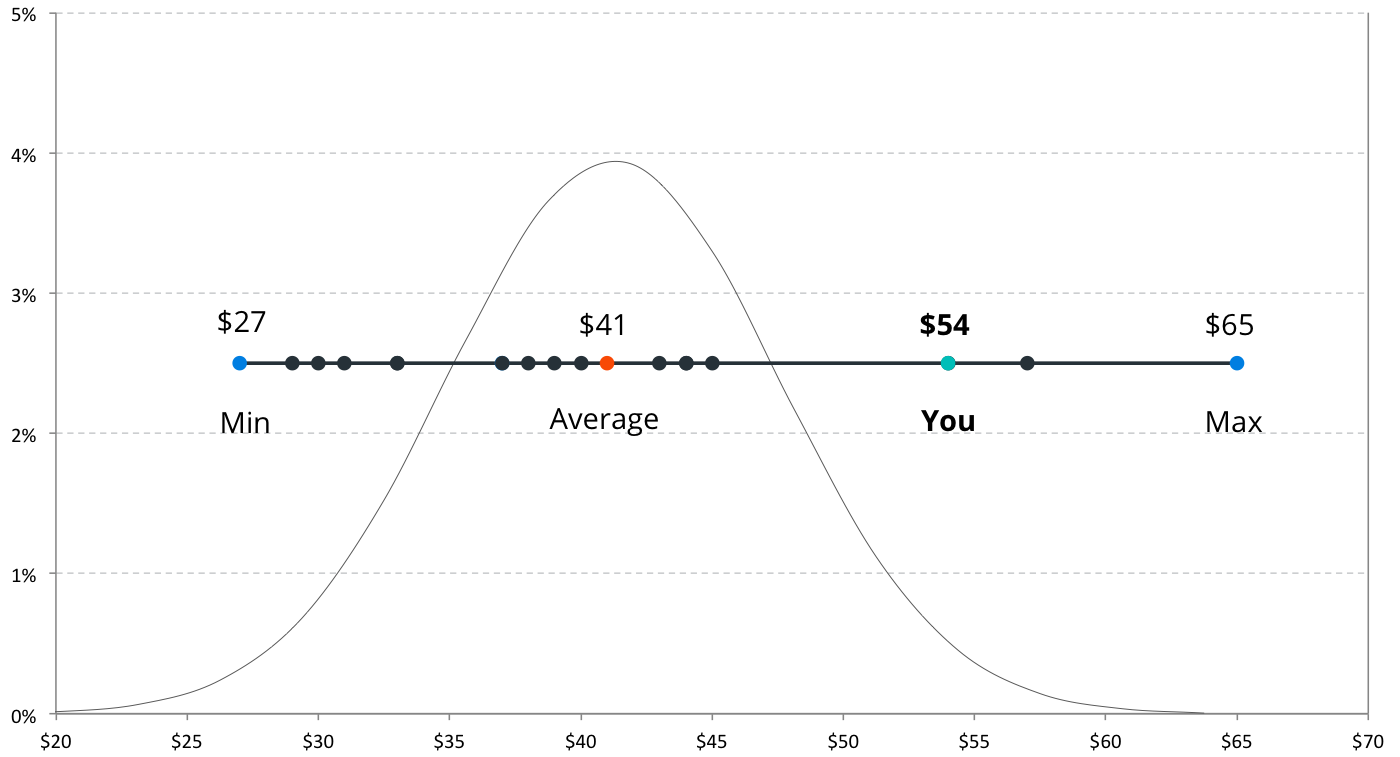
Expenditure per capita is a measure of the value that a community is prepared to assign to operations of its library service. This library service has an above average expenditure per capita — ranking third overall. This again highlights the importance of the library service to the community, and the role of investors in maintaining its high quality.
Respondents were given the opportunity to leave additional comments about the library service. A selection of these comments is diplayed below.
The Culture Counts digital platform aims to capture survey responses via various methods at minimal marginal cost. Achieving larger samples enables organisations to be confident that the average scores and opinions of the survey group are representative of the total membership.
This chart shows the margin for error for each dimension from the sample.
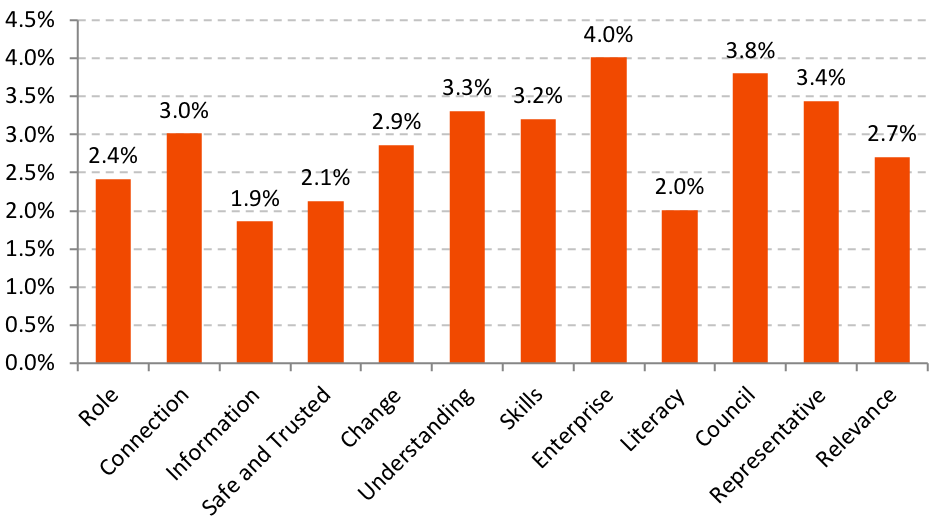
At a 95% confidence interval, the margin of error for dimensions ranged from 1.9% to 4.0%.This means that we can be 95% confident that if we surveyed the entire membership population, the average score for Role would fall within 2.4% of the average generated by the sample.
Margins of error under 5% are considered reasonable representations of the opinion of the population. As the margin or error is below 5% this sample can be deemed statistically significant and an accurate representation of the library's membership.