Background
Shire of North Rock
The Shire of North Rock delivers a broad range of events to its residents to support the wellbeing and prosperity of its community. The shire understands the value and impact of arts and culture, and the important role of cultural development in helping to achieve social, economic, environmental and wellbeing objectives for the community. The Shire boasts a large and diverse events program that incorporates community, arts and culture.
The Shire of North Rock events program comprises:
The following report identifies community responses and benchmarks for council events to identify outcomes, benefits and learnings.
Evaluation Methodology
The Shire of North Rock engaged Culture Counts to conduct an evaluation of events and programs, as well as to assess the economic impact. The evaluation was conducted by surveying members of the general public. Surveys were delivered through intercept interviews organised by Culture Counts and distributed by The Shire of North Rock. In partnership with Culture Counts, surveys were designed and developed to evaluate the strategic goals and outcomes of the Shire of North Rock.
1,206 responses were collected from public attendees via intercept interviews.
Each survey contained a range of ‘dimension’ questions, asking stakeholders about their experience of the event. These dimensions have been developed and tested in collaboration with industry, practitioners and academics to measure the impact and value of arts and cultural events and activities.
Appropriate dimensions were chosen based on their alignment with the shire's strategic objectives.
Public Assessment
| Domain | Dimension | Dimension statement |
|---|
| Community | Belonging | It helped me feel part of the community |
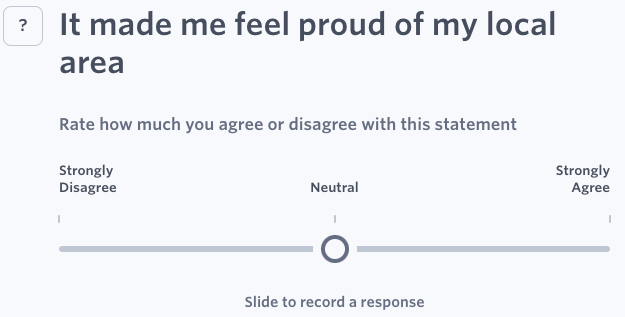
| Place | It made me feel proud of my local area |
| Cultural | Celebration | It celebrated my own cultural heritage |
| Insight | It helped me gain new insight or knowledge |
| Economic | Diversity | It engaged people from different backgrounds |
| Qualities | Content | It reflected a broad and inclusive range of voices |
| Local Impact | It's important that it's happening here |
| Rigour | It was well thought through and put together |
| Social | Access | It gave me the opportunity to access activities I would otherwise not have access to |
| Safe | It made me feel safe and welcome |
Dimensions are assessed on a Likert scale, in which respondents move a slider to a point that indicates whether they agree or disagree with the dimension statement. An example of a dimension question in the Culture Counts survey tool is presented below.