Background
Midsumma Festival
Midsumma Festival is Victoria’s premier LGBTQIA+ festival. A cross-generational festival that champions LGBTQIA+ ideas, stories and experiences through conversations and events.
Usually held in the summer months each year, the festival is a three-week program made up of visual arts, theatre, spoken word, cabaret, film, live music, parties, sport, social events and public forums. The organisation also works year-round to provide support and tools to artists, social-changers and culture-makers.
Midsumma is a unique and innovative presentation of queer arts and culture that brings together a mix of artists, performers and communities. Due to COVID-19, in 2021 Midsumma Festival ran from 19 April to 5 May, with Midsumma Pride March on Sunday 23 May. Some events were restricted in capacity due to capped venue numbers and therefore Midsumma Festival augmented events with live and livestream to assist in reach and attendance.
Evaluation Methodology
Organisers of Midsumma Festival engaged Culture Counts to conduct an evaluation of this year’s event. Attendees were surveyed via interview by Midsumma volunteers across Midsumma Festival, as well as an open link to the online survey via the Midsumma website and enewsletter.
In total, 653 members of the public were surveyed through the interviews (325) and online surveys (328).
Each survey contained a range of ‘dimension’ questions, asking members of the public about their experience of the event. These dimensions have been developed and tested in collaboration with industry, practitioners and academics to measure the impact and value of arts and cultural events and activity.
Appropriate dimensions were chosen based on their alignment with Midsumma Festival's strategic objectives.
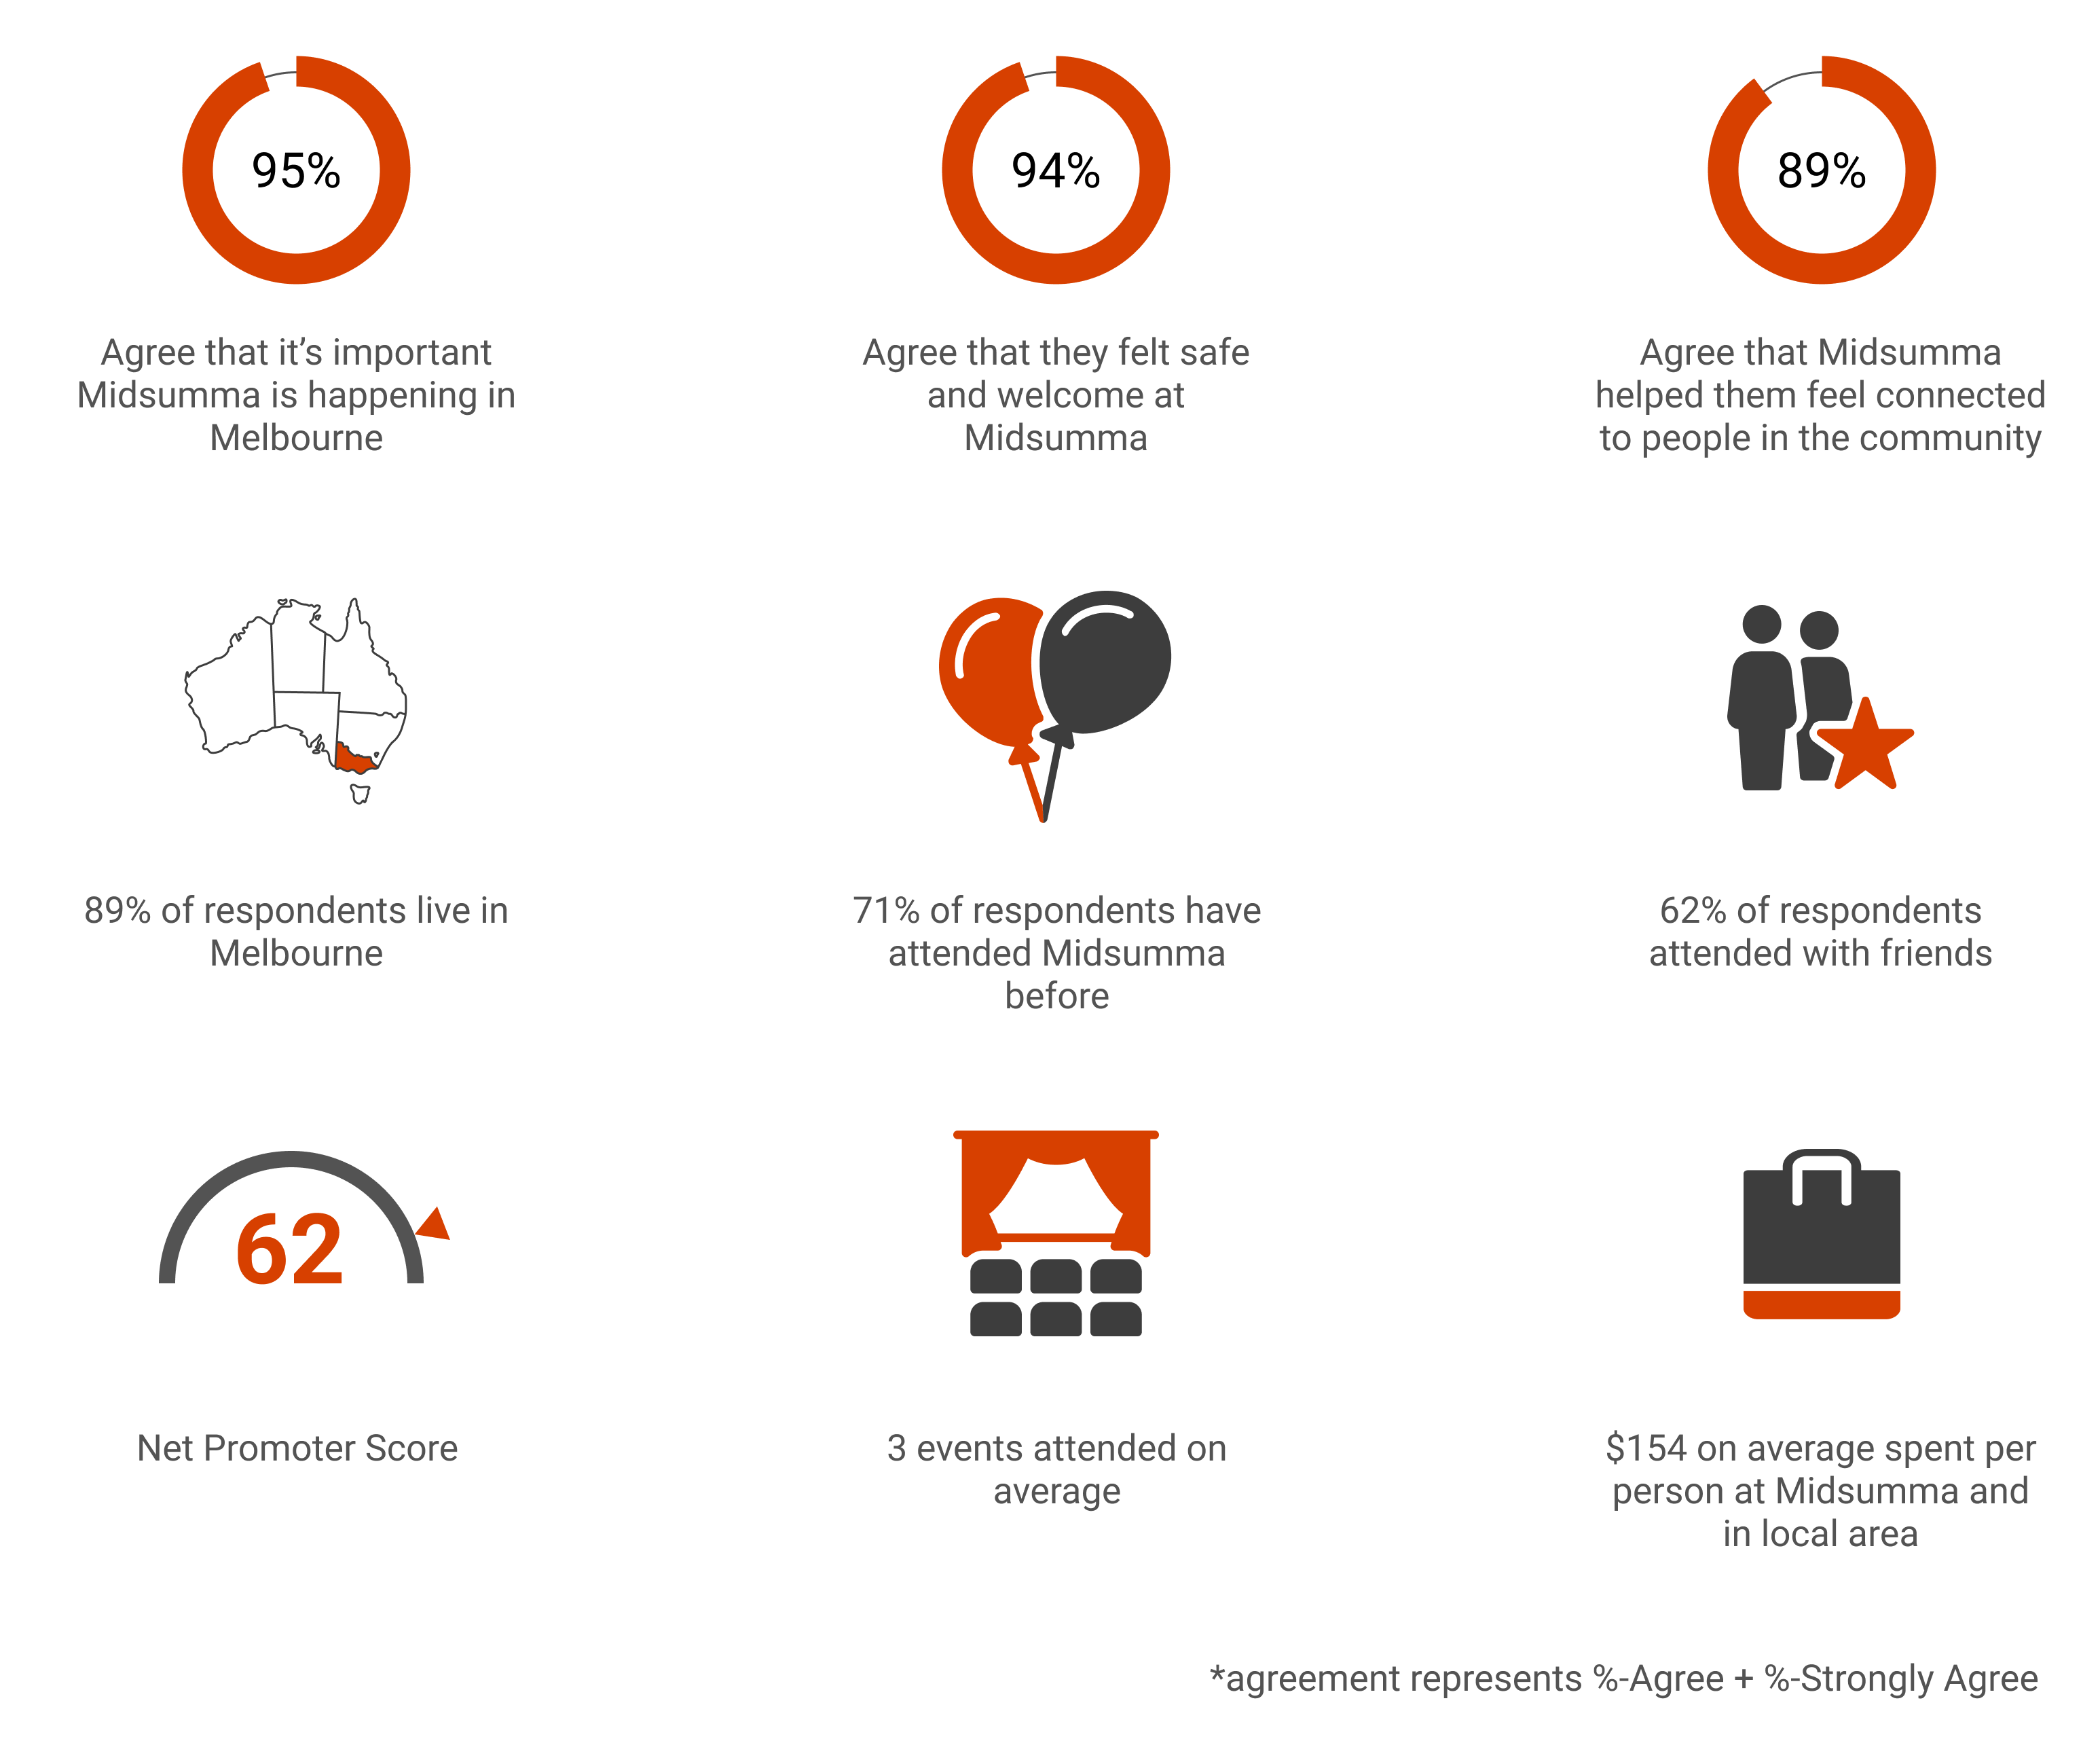
Public Assessment
| Domain | Dimension | Dimension Statement |
|---|
| Cultural | Meaning | It moved and inspired me |
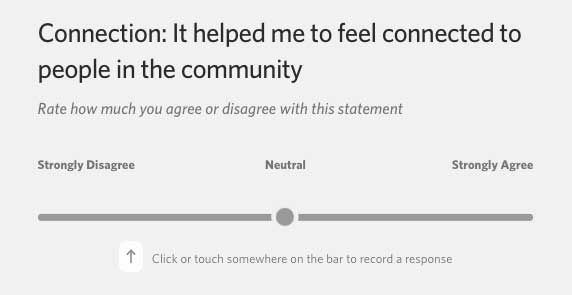
| Social | Connection | It helped me to feel connected to people in the community |
| Safe | It made me feel safe and welcome |
| Wellbeing | It had a positive impact on my physical health and mental wellbeing |
| Quality | Local Impact | It's important that it's happening here |
Dimensions are assessed on a Likert scale, in which respondents move a slider to a point that indicates whether they agree or disagree with the dimension statement. An example of a dimension question in the Culture Counts survey tool is presented below.