Use your keyboard arrow keys to navigate
Contents
▲
Photo: Pexels
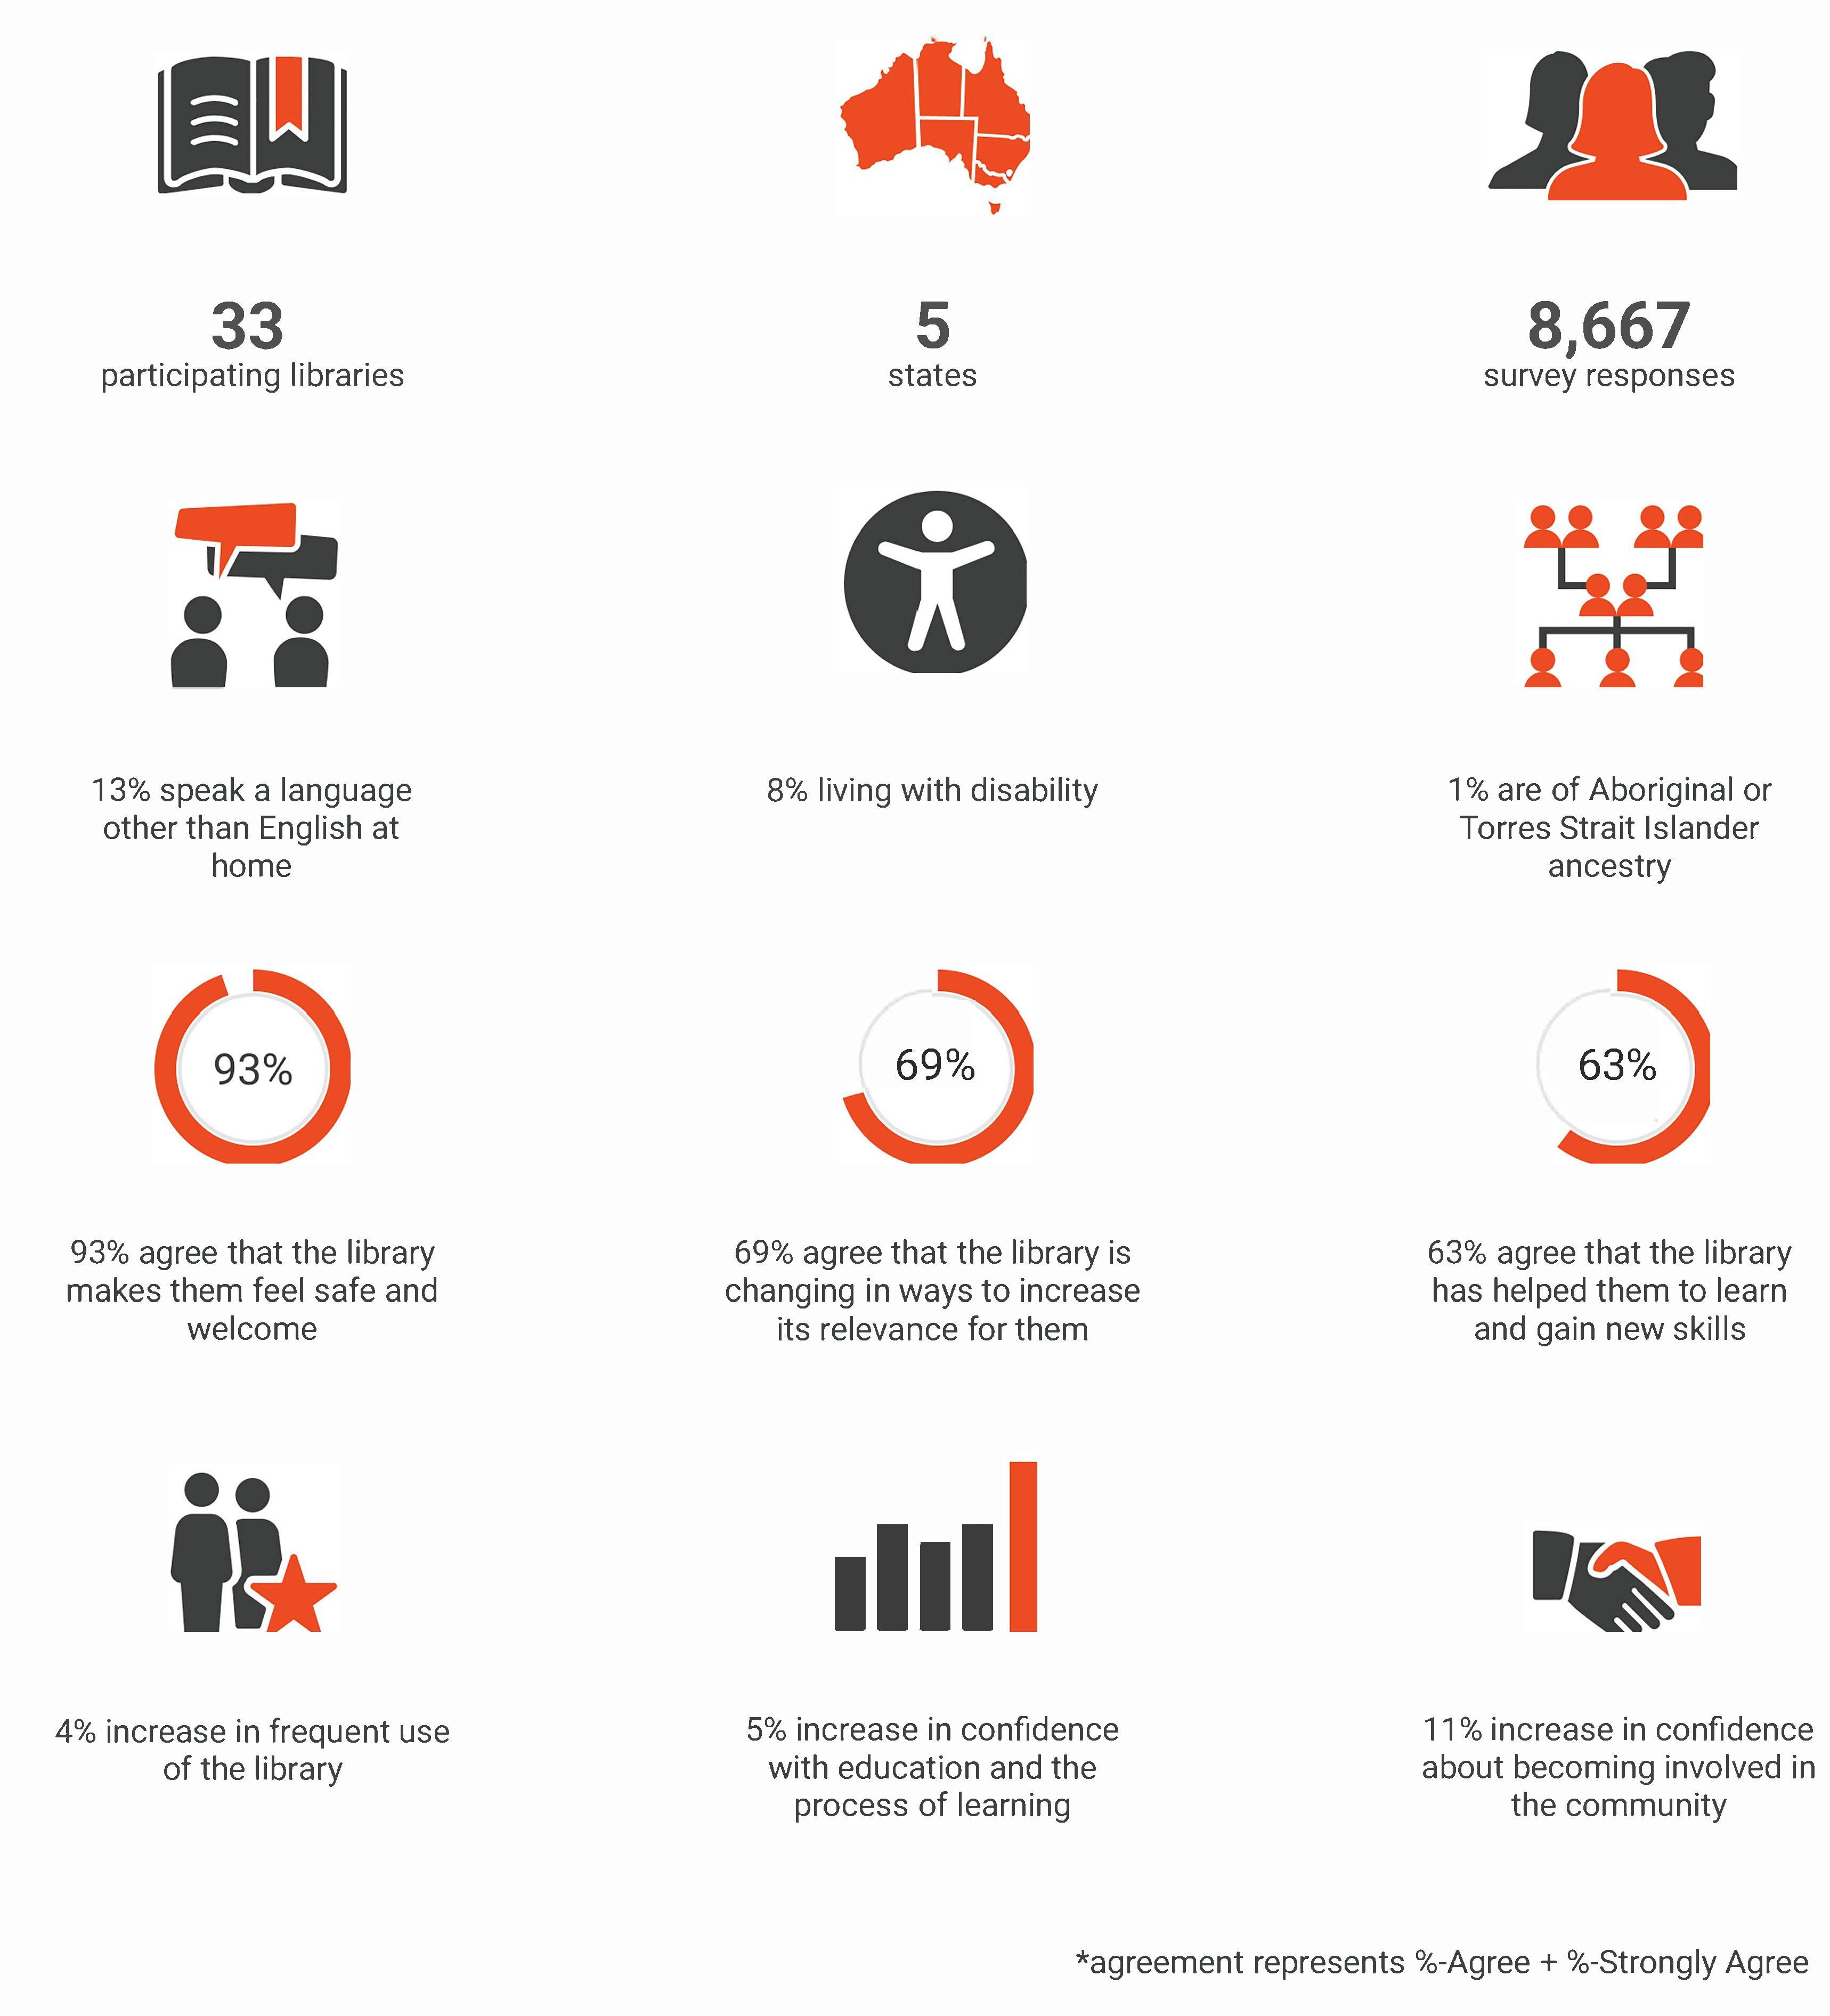
Project Highlights
▲
Photo: Canva
Project Overview
Culture Counts, in conjunction with Public Libraries Australia (PLA) and more than 30 participating libraries across Australia, has completed the fourth year of a nation-wide data collection initiative to better understand and illustrate the vital outcomes generated by libraries. This document provides a snapshot of the Public Library Evaluation Network (PLEN) results from 2022-23, along with year-on-year comparisons beginning from the first year of the project.
Aim
Libraries are an extremely important asset to local communities, but membership numbers and lending statistics only address a small part of the value of a library to its community. Measuring the role of libraries and the value that communities place on them gives libraries the ability to engage more deeply with the public, impact the community more strongly, and provide an evidence-based argument for greater funding. The use of standardised measures means that libraries can learn from direct comparisons with their peers, or from wider sector trends and insights. The project gives libraries the opportunity to test outcome metrics and evaluation methods and provide feedback to ensure appropriateness from an Australian library perspective.
Network Methodology
Participating libraries subscribe to the Culture Counts survey platform; accessing standardised survey templates, unlimited evaluations, in-built metrics, client support and training. Each library surveys public library users at least once annually on outcome measures and usage, and provides the project with annual data related to library expenditure, collections, loans and visitation. All results collected through the project contribute to a large body of evidence about the value of the sector as a whole, with participants able to access a dynamic, filterable big data dashboard. Participants also receive an advocacy report that celebrates their own annual results. Quarterly webinars enable participants to connect, interrogate the big data dashboard, and discuss implications and learnings.
Evaluation Methodology
Libraries involved in the network collect feedback on library use, performance, personal and community outcomes from public users of the library. This feedback is collected through a short standardised online survey (~4 minutes) that the library can email to its member database, link to on internal computers, deliver to library users via an iPad or tablet device, or encourage users to complete on their own smart phones.
Library staff (self-assessors) and external peer assessors (such as council members or library staff from another library) are also able to reflect on the library service using the same standard outcome measures. This can help the library to identify where its views and expectations are aligned or different to those of the community.
A representative of the library also completes an additional survey for the annual period containing library lending, staff and expenditure statistics.
▲
Photo: Mark Cruzat
Library Outcomes
A key part of the project involves asking community members around Australia if they agree or disagree with a statement relating to their experience of the library service, across 11 key outcome areas. Outcomes assessment provides evidence of the impact that library services have on people’s lives and the value that this adds to personal, community and economic wellbeing. The outcome areas align with the Outcome Measures for Australian Public Libraries research (ALIA, APLA, NSLA), ILFA generic learning and social outcomes, Project Outcome, and other community indicator research in Australia and overseas.
The use of standardised measures means that libraries can learn from direct comparisons with their peers, or from wider sector trends and insights. The results help the library to learn where they are generating the greatest impact, where they can improve, and whether certain outcome areas are more relevant or impactful to specific demographics or community groups.
The first chart below shows the percentage of respondents across the whole Public Libraries Evaluation Network who agreed with the associated statement regarding their library experience in 2022-23. The second chart includes the percentage of respondents who strongly disagree, disagree, or are neutral about the outcome statement. The third chart shows the percentage of respondents who agreed with the statement in each year of the project, identifying where the network libraries have seen improvement and how library outcomes have changed over time.
Loading...
Loading...
Year on year
Loading...
Insights
The research shows that communities overwhelmingly agree that libraries play an important role and are felt to be safe and welcoming places. Libraries are also succeeding strongly in their more traditional literacy and learning roles, encouraging users to read more and enjoy learning. Over two thirds of respondents also agreed that their library is changing and becoming more relevant to them and their needs, indicating that greater outcomes may follow in newer library focus areas, such as digital inclusion and enterprise.
Year on year comparisons indicate that libraries participating in the network have increased their impact from 2021-22 across six library dimensions and recorded the same levels of agreement for three dimensions. Two dimensions have seen lower levels of agreement in 2022-23 following a spike in 2020-21, and only two dimensions have decreased slightly overall since the project started in 2019-20.
A small selection of insights derived from filtering the dynamic dashboard by age, identity, status and location include:
-
Respondents of Aboriginal or Torres Strait Islander ancestry recorded higher than average scores for all outcome areas except for Relevance and Role
-
Respondents who speak a language other than English recorded higher than average outcomes for all dimensions. They also scored highly in all event and program dimensions, particularly Learning, Creativity and Cultural Contribution
-
Respondents across most age cohorts highly agree that they feel safe and welcome when using the library service and that the library is an important part of the place where they live
-
Respondents aged over 80 are most likely to find that the library meets their informational and reading needs. They also feel that the library encourages them to read more, plays an important role and is a safe and trusted space, but have lower outcomes across other areas
-
There were no significant differences in outcomes experienced by male and female respondents, however respondents identifying as an alternative gender recorded below average scores for four of the recorded dimensions
-
Non-members scored below average in all dimensions besides Information and Skills, indicating they were most likely to value the library for information and reading needs, learning and gaining new skills, but less likely to value the role of the library than members
-
Respondents who had used the library within the last week scored slightly higher than average results for most dimensions, particularly Time with Children and Enterprise
▲
Photo: Pexels - Mikhail Nilov
ALIA/APLA Outcomes Alignment
To ensure that all data collected can be clearly reported against the achievement of important sector objectives, Culture Counts aligned outcome metrics used in the project with Australian Library and Information Association (ALIA) and Australian Public Library Alliance (APLA) outcome areas, and the UK Inspiring Learning for All (ILFA) social and learning outcomes. This enables the library sector to build on significant research already carried out by peak bodies in Australia and internationally.
This page contains a matrix aligning project outcome metrics with ALIA and APLA outcome areas (as described in their published Guidelines, Standards and Outcome Measures for Australian Public Libraries, July 2016).
Underneath the matrix, the dials illustrate the percentage level of agreement recorded by respondents across the project network for each of the six ALIA/APLA key outcome areas. This is followed by year on year comparisons for the four years of the project.
| ALIA/APLA Outcomes | Dimension Name | Library Outcome Measure |
|---|---|---|
| Community Engagement | Connection | The library has encouraged me to become more engaged in the community |
| Role | The library is an important part of the place where I live | |
| Relevance | The library is changing in ways that increase its relevance for me | |
| Digital Inclusion | Digital Connection | The library helps me to be more digitally connected to others |
| Economic and Workforce Development | Enterprise | The library has helped me to improve the success of my business |
| Literacy and Lifelong Learning | Time with Children | The library has helped me to spend more quality time with my children |
| Skills | The library has helped me to learn and gain new skills | |
| Literacy | The library has encouraged me to read more | |
| Personal Development and Wellbeing | Learning | The library has helped me to enjoy learning |
| Stronger and Creative Communities | Safe and Trusted | The library makes me feel safe and welcome |
| Creativity | The library has helped me be more creative in my own life and work |
Loading...
Year on year
Loading...
Insights
Strong levels of agreement - greater than 70% of respondents across the network - were recorded for four of the six ALIA/APLA outcome areas, with libraries felt to contribute most to the development of Stronger and Creative Communities (82%) and Personal Development and Wellbeing (76%).
Year-on-year data shows that four out of the six outcome areas increased in 2022-23 compared with the previous year, whilst Digital Inclusion remained the same. Community Engagement saw a minor decrease from 2021-22.
Results recorded by libraries for Stronger and Creative Communities, Community Engagement, Personal Development and Wellbeing, Literacy and Lifelong Learning and Economic Workforce Development were higher in 2022-23 than when the project began, while Digital Inclusion remained 3% lower. Economic & Workforce Development saw the greatest variation in results across the year-on-year data.
▲
Photo: Canva
ILFA Learning Outcomes
This page contains a matrix aligning project outcome metrics with ILFA Learning outcome areas.
Underneath the matrix, the dials illustrate the percentage levels of agreement recorded by respondents across the project network for each of the five ILFA Learning outcome areas. This is followed by year-on-year comparisons for the four years of the project.
| ILFA Learning Outcomes | Dimension Name | Library Outcome Measure |
|---|---|---|
| Activity, Behaviour and Progression | Connection | The library has encouraged me to become more engaged in the community |
| Digital Connection | The library helps me to be more digitally connected to others | |
| Time with Children | The library has helped me to spend more quality time with my children | |
| Attitudes and Values | Role | The library is an important part of the place where I live |
| Relevance | The library is changing in ways that increase its relevance for me | |
| Enjoyment, Inspiration and Creativity | Safe and Trusted | The library makes me feel safe and welcome |
| Creativity | The library has helped me be more creative in my own life and work | |
| Knowledge and Understanding | Learning | The library has helped me to enjoy learning |
| Literacy | The library has encouraged me to read more | |
| Skills | Enterprise | The library has helped me to improve the success of my business |
| Skills | The library has helped me to learn and gain new skills |
Loading...
Year on year
Loading...
Insights
Strong levels of agreement - greater than 80% of respondents across the network - were recorded for three of the ILFA Learning outcome areas, with libraries felt to contribute significantly to Enjoyment, Inspiration and Creativity (82%); Attitudes and Values (81%); and Knowledge and Understanding (80%).
Year-on-year data shows that results for Knowledge and Understanding have improved from 2021-22, while Activity, Behaviour & Progress and Skills improved when compared with the 2021-22 outcomes but fell slightly short of their peak in 2020-21. Attitudes and Values recorded the highest levels of agreement every year, except for 2022-23 where it fell one percentage point below Enjoyment, Inspiration and Creativity.
▲
Photo: Canva
ILFA Social Outcomes
This page contains a matrix aligning project outcome metrics with ILFA Social outcome areas.
Underneath the matrix, the dials illustrate the percentage level of agreement recorded by respondents across the project network for each of the three ILFA Social outcome areas. This is followed by year-on-year comparisons for the four years of the project.
| ILFA Social Outcomes | Dimension Name | Library Outcome Measure |
|---|---|---|
| Stronger and Safer Communities | Connection | The library has encouraged me to become more engaged in the community | Safe and Trusted | The library makes me feel safe and welcome |
| Digital Connection | The library helps me to be more digitally connected to others | |
| Time with Children | The library has helped me to spend more quality time with my children | |
| Health and Wellbeing | Enterprise | The library has helped me to improve the success of my business |
| Learning | The library has helped me to enjoy learning | |
| Skills | The library has helped me to learn and gain new skills | |
| Literacy | The library has encouraged me to read more | |
| Creativity | The library has helped me be more creative in my own life and work | |
| Strengthening Public Life | Role | The library is an important part of the place where I live |
| Relevance | The library is changing in ways that increase its relevance for me |
Loading...
Year on year
Loading...
Insights
Strong levels of agreement - greater than 80% of respondents across the network - were recorded for the ILFA Social outcome area related to Strengthening Public Life (81%).
Year-on-year data shows that results recorded by libraries in the network increased in Health and Wellbeing and Stronger and Safer Communities. Despite recording the highest scores, Strengthening Public Life fell slightly short of the 2021-22 results. Both Health and Wellbeing and Stronger and Safer Communities have increased overall since the project started in 2019-20.
▲
Photo: Nur Yilmaz
Library Awareness
Respondents were asked whether they were aware of various library resources and services, and whether the library helps them to learn, apply learnings and gain confidence across these service areas. These four stages are expected to be sequential, with library users initially gaining awareness, followed by learning something new, application of learnings and increased confidence.
Awareness: The library has helped me be more aware of applicable resources and services it provides in the following areas
Learning: The library has helped me learn something new in the following areas
Application: I intend to apply what I’ve learnt at the library in the following areas
Confidence: The library has helped me feel more confident
The chart below shows the proportion of respondents who indicated that the library helped their awareness, learning and application across seven resource areas, and gives insight into their progression through each stage. This is followed by a set of charts showing the year-on-year comparisons for awareness, learning and application. Confidence is reported separately, as the areas of interest are worded differently.
Awareness, Learning, and Application
Loading...
The question statements for each category were as follows: Awareness: The library has helped me be more aware of applicable resources and services it provides in the following areas; Learning: The library helped me learn something new in the following areas; and Application: I intend to apply what I've learnt at the library in the following areas.
Loading...
Loading...
Loading...
Confidence
Loading...
Loading...
Insights
As illustrated by the dimension results, libraries appear to be succeeding in raising awareness and facilitating learning in the traditional areas of reading and education, while also playing an important role as a safe civic space for their communities to connect. Increasing awareness of the changing role of libraries in developing business opportunities and job skills may lead to improvements in learning, application and confidence in these areas.
Year-on-year data shows that awareness, learning and application has increased in areas such as civic/community engagement, education, lifelong and digital learning. Reading and literacy, and early childhood literacy outcomes have fallen slightly across the three areas, particularly application which saw a peak in 2021-22.
Confidence surrounding community involvement, digital resources and education saw a sharp increase in 2022-23. Confidence levels for reading remained steady, with about half of the sample indicating the library helped them feel more confident in this area.
A small selection of insights derived from filtering the dynamic dashboard by age and gender include:
-
Respondents aged under 20 recorded much higher awareness, learning and application associated with reading/literacy, and education; and higher confidence with reading, education and the learning process as a result of their library experience
-
Respondents aged 20-29 demonstrated much higher awareness, learning and application associated with civic/community engagement and economic/business development, and greater confidence about reading and education and the process of learning
-
Respondents aged 40-49 demonstrated much higher awareness, learning and application associated with early childhood literacy; and greater confidence with helping children learn
-
Respondents aged 50-59 had higher than average awareness, learning and application in all areas except early childhood literacy. This cohort also showed higher than average confidence with their education and the process of learning, and lower results for community involvement
-
Respondents aged 70-79 had greater than average awareness of digital learning services, and lower than average awareness of childhood literacy, job skills and economic/business development
-
Respondents aged over 80 years had higher than average confidence when using digital resources
-
Respondents who identified as female demonstrated higher awareness, learning and application associated with reading and literacy, and civic/community engagement
▲
Photo: Pexels - Yan Krukau
Library Use
Respondents were asked their frequency of library use and whether they engaged with library facilities, services and events. This helps libraries to understand usage by demographics and identify links between use and outcomes.
Loading...
Loading...
Loading...
Loading...
Loading...
Loading...
Insights
The data shows that survey respondents are most likely to be engaged users of the library, with more than half having accessed the library service within the last week. This figure has remained constant over the four years of the project, along with the percentage of respondents who haven't used the library in longer than six months.
80% used the facilities or services at the library (just 2% down from 2021-22), while 56% used library services online from home (up from 53% in 2021-22). Just under one third (29%) attended an event or program at the library, indicating a return to figures demonstrated in 2019-20 and 2020-21.
In 2022-23, 3% of respondents were not library members. This was slightly down from 2% in 2021-22, and of significant difference from 2020-21 when 20% of respondents were not library members. This is believed to reflect the increased use of online programs, services and activities provided by libraries during the Covid lockdowns, which encouraged the use of the library by people who were not traditional users.
A small selection of insights derived from filtering the dynamic dashboard by age, gender and identity include:
-
Respondents aged 20-29 years are more likely to access library services online from home, and less likely to attend an event or program at the library
-
Respondents aged 30-39 years are much more likely than average to attend an event or program, and more likely to identify as female
-
Respondents aged 60-69 were less likely than average to attend an event or program. Over half of this sample indicated they had visited their library within the last week
-
Respondents that identified as living with a disability were more likely to use the facilities or services at the library, but less likely to attend an event
-
Respondents of Aboriginal or Torres Strait Islander ancestry are more likely to be under 40, and less likely to access library services online from home
▲
Photo: Pexels
Demographics
Demographic information is collected to enable participating libraries and the network as a whole to understand the communities that they service, the impact of services for different groups, and gaps and opportunities for broader and deeper engagement. The 8,667 survey respondents across the network in 2022-23 represent a mix of ages, genders and identities, ensuring that the opinions of a broad range of community members are reflected.
Loading...
Loading...
Loading...
Loading...
Loading...
Loading...
Insights
The data shows that survey respondents are most likely to be female (74%, up from 73% in 2021-22 and down from 76% in 2020-21), and in the 60-79 age group (42% in 2022-23, dropping from 43% in 2021-22). The largest percentage of respondents identified as speaking a language other than English at home (13% in 2022-23, down from 17% in 2021-22). The percentage of Aboriginal or Torres Strait Islander respondents remained the same from 2021-22, but saw an overall decrease from 2019-2020 and 2020-21. Those identifying as LGBTIQA+ increased from 5% in 2021-22 to 8% in 2022-23. The percentage of respondents living with disability increased from 7% in 2021-22 to 8% in 2022-23.
▲
Photo: Pexels
Outcomes by Demographics
The charts below apply the age and gender filters to the dimension results to identify where there are differences in outcomes experienced by respondents based on their age or gender.
Loading...
Loading...
Insights
The data shows that the differences in dimension results by age group are not significant for eight of the 11 dimensions, with larger differences occurring for Skills (outcomes falling as age increases), Time with Children (lower outcomes for respondents over 60 years), and Digital Connection (lower outcomes for respondents under 20). The most consistent dimension amongst age groups is Safe and Trusted, with average scores ranging from 88-90%.
The data shows that there were not significant differences in the outcomes experienced by male and female respondents, with females recording marginally higher outcomes for nine of the 11 dimensions and equal outcomes for one dimension (Digital Connection). The one significant difference was for the Time with Children outcome, in which females recorded average scores 9% higher than male respondents. Respondents who identified as an alternative gender recorded slightly higher averages for seven dimensions, when compared to males. This cohort also recorded the highest average for Creativity and Enterprise.
▲
Photo: Canva
Open Text Analysis
Qualitative feedback was provided in the form of responses to two open-ended questions contained in the Library Use and Outcomes Survey:
-
"What do you like most about your library?", and
-
"What could the library do to improve?"
While open text questions provide a wealth of information for libraries, it can be time-consuming to review all responses, interpret the general themes and issues, and then use them to make meaningful change that appeals to a significant proportion of respondents.
In order to assist libraries in quickly understanding the key topics of interest for respondents, Culture Counts carried out a thematic analysis of the open text responses (more than 10,000 responses collected for each question across the network) to identify recurring themes in the text responses.
The charts below show the percentage of responses that align with each of a selection of key topics identified through the analysis. Note that each response can mention multiple themes, while others may not mention any of the key themes identified. This means that the proportions will not necessarily sum to 100%.
Loading...
Loading...
▲
Photo: Canva
Talk to us
We would love to partner with you on your evaluation journey. Please complete the enquiry form and we will be in touch! Or download our free Library Evaluation Guide to help you get started.
Data and Insights by
This report has been prepared by Culture Counts.
We respectfully acknowledge the Traditional Owners of Country throughout Australia and recognise the continuing connection to lands, waters and communities. We pay our respect to Aboriginal and Torres Strait Islander cultures, and to Elders past and present.