Use your keyboard arrow keys to navigate
10.3K
Attendance
6
Dimension Metrics
382
Survey Responses

Contents

Shalom Annual Report 2021 —

Background

Shalom

Shalom enables people to enrich their life, culture, education and professional endeavors through Jewish activity. They engage people of different ages and backgrounds through a variety of targeted programs and special events. Their program types include Arts & Culture, Talks, Kids & Family and Leadership & Innovation, meaning they attract an audience with a wide variety of interests.

They have also a strong focus on building connections and community for people living in Sydney however, they also have attendees from other areas such as Melbourne. Some of their 2021 programs included Limmud, Sydney Jewish Writers Festival, Adamama, The Nadav Project and PJ Library.

2021 Attendance Statistics
Term2021 Actuals
Total number of young adults4,559
Young adults who attended for the first time638 (14%)
The average number of times a participant engaged with Shalom 1.6
The total number of times young adults participated in Shalom programs 7,334
Total number of times participants engaged with Shalom programs10,334

Evaluation Methodology

Shalom engaged Culture Counts to conduct an evaluation of its annual activity. The evaluation was conducted by surveying members of the general public. Surveys were delivered through intercept interviews organised by Culture Counts and distributed to ticket holders. In partnership with Culture Counts, this survey was designed and developed to evaluate the strategic goals and outcomes of Shalom.

382 responses were collected from public attendees via an online survey.

Each survey contained a range of ‘dimension’ questions, asking stakeholders about their experience of the Shalom activities. These dimensions have been developed and tested in collaboration with industry, practitioners, and academics to measure the impact and value of arts and cultural events and activities.

Appropriate dimensions were chosen based on their alignment with the festival's strategic objectives. Three additional custom dimensions were added for Shalom.

Public Assessment
DomainDimensionDimension statement
QualityConceptIt was an interesting idea/programme
CulturalHeritageIt made me feel connected to a shared history/culture
MeaningIt moved and inspired me
RelevanceIt gave me a better understanding of today's world
InsightIt helped me gain new insight or knowledge
SocialInclusionIt made me feel welcome and included
ShalomVibrancyShalom enhances the overall vibrancy of the Sydney Jewish community
ConnectionShalom helps me feel connected to people in the Sydney Jewish community
EngagementShalom programs enhance my engagement with the Sydney Jewish community

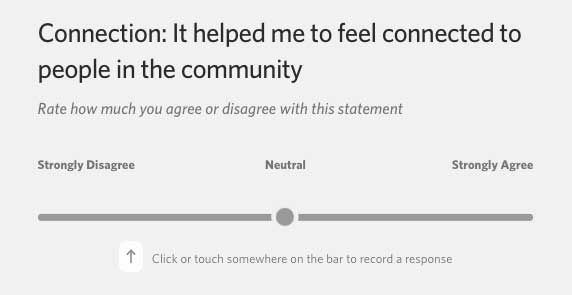
Dimensions are assessed on a Likert scale, in which respondents move a slider to a point that indicates whether they agree or disagree with the dimension statement. An example of a dimension question in the Culture Counts survey tool is presented below.

likert scale example
Shalom Annual Report 2021 —

Respondent Profile

Demographics

Survey respondents were asked to provide their age, gender, and identity. This data identifies the demographic sample of people who responded to the survey and took part in the event. It enables data to be matched to the wider population and responses to be filtered to understand differences in demographics.

The following charts show the proportion of survey responses captured for each of the age, gender, and identity demographic questions.

Loading...
Loading...
Loading...
Loading...
Loading...
Loading...

Insights

Overall, the largest age group of respondents was those over 60 (37%), followed by those aged 30-39 (29%). The 40-49 age group made up 20% of the total sample, the 50-59 age group made up 10% of the sample, those aged 20-29 made up 5% and those aged under 20 made up less than 1%.

The predominant age group of respondents varied greatly across programs. For the 'PJ Library' program, the majority of respondents (57%) were aged 30-39, followed by those aged 40-49 (28%) and those aged over 60 (12%). Whereas, the majority of respondents for the 'Limmud' and 'Sydney Jewish Writers Festival' programs were over 60 (51% and 67% respectively). The 'Adamama' program showed greater variety in respondent ages, with every age group (except those under 20) representing between 13% and 33% of the respondent population. There were not enough respondents from 'The Nadav Project' or 'Other' to draw insights from. Of those who did not attend a program in the last six months, the majority (61%) were over 60. The majority (80%) of the sample were female, with males making up 20% of the sample and those who identified their gender in another way making up less than 1%.

24% of the sample indicated that they were from a culturally diverse background, with another 5% indicating that they identify as LGBTIQ+. 4% identified as a person with a disability and less than 1% identified themselves as Aboriginal and/or Torres Strait Islander.

Shalom Annual Report 2021 —

Location and Engagement

Survey respondents were asked to indicate which Shalom programs they attended, how many communal events they attended, as well as their current postcode. This data identifies the demographic sample of people who responded to the survey and took part in each program. It enables data to be matched to the wider population and responses to be filtered to understand differences in demographics.

The following charts show which programs respondents engaged with in 2021, how many communal events they attended and their living locations.

Loading...
Loading...
Loading...
Respondent Residence by Postcode - Sydney
What is your postcode?
Respondent Residence by Postcode - Melbourne
What is your postcode?

Insights

In 2021, the majority (47%) of respondents engaged with 'PJ Library'. A further 29% engaged with 'Limmud', 19% with the 'Sydney Jewish Writers Festival', 18% with 'Adamama' and 2% with the 'Nadav Project'. 4% of respondents engaged with 'Other' projects and 19% did not engage with any programs in the last six months.

The majority of respondents (64%) attended 0-3 communal events in 2021. 18% attended 4-5 communal events, 6% attended 6-7, 2% attended 7-9 and 10% attended 10 or more in 2021.

The most commonly cited postcode was Rose Bay (10%), this was followed by Tamarama (6.3%), Bellevue Hill (5.9%), Vaucluse (5.0%) and Clovelly (4.6%). The Sydney and Melbourne heatmaps give a visual representation of where respondents attended from.

Shalom Annual Report 2021 —

Denomination & Identity

Respondents were asked about their denomination and their sense of Jewish identity. Denomination results have been split by age for comparative purposes, as well as compared to the Gen 17 Survey. These comparisons allow Shalom to see how those it engages with change by age, as well as how they represent the broader Jewish community.

Jewish identity was asked across a 5-point scale. The scale sought to measure three components of Jewish identity:

  • How strong the individual personally identified as Jewish

  • The social network a respondent had, and whether this network was significantly Jewish

  • The level of engagement a respondent had within the broader Jewish community

Results for both questions are shown below.

Loading...
Loading...
Options have been shortened for illustrative purposes. See footnote for full response options.
Loading...
Loading...
Loading...
Loading...

Insights

The majority (39%) of respondents identified as having a strong Jewish identity, the majority of their social network is Jewish, and they are actively involved in helping create a strong and vibrant Jewish community. 32% of respondents identified as having a strong Jewish identity, the majority of their social network is Jewish, but they are not actively involved in helping to create a strong and vibrant Jewish community. 21% of respondents indicated that they had a Jewish identity, however, the majority of their social network is not Jewish, and they are not actively involved in actively creating a strong and vibrant Jewish community. 13% expressed that their Jewish identity is not a major factor in their life, the majority of their social network is not Jewish, and they only get involved in Jewish activities if they align with their interests or passions. A further 5% suggested that their Jewish identity is not a major factor in their life, the majority of their social network is not Jewish, and they are not involved in Jewish activities.

When asked if they identified with a particular denomination 23% identified as 'Traditional' and 23% identified as 'Just Jewish'. 17% identified as 'Modern Orthodox', 15% as 'Progressive', 10% as 'Secular' and 4% as 'Conservative'. A further 2% identified as 'Mixed Religion', 5% identified as 'None of the above' and no respondents identified as 'Haredi'. When comparing denominations by age, the percentages of each age group across all denominations are fairly consistent, showing that age has little impact on denomination. Across all denominations, the majority of respondents were over 60 (between 31% and 41%), this was followed by those aged 30-39 (between 18% and 34%) and those aged 40-49 (between 13%-27%). Those aged 20-29 and 50-59 consistently made up smaller proportions of the sample and 100% of respondents aged under 20 identified as 'Modern Orthodox'. There were not enough respondents who identified as 'Mixed Religion' to draw insights from.

When compared to the Gen 17 survey the results for those who identified as 'Modern Orthodox', 'Conservative' and 'Mixed Religion' were all very similar (within 1% of each other). However, there were more respondents who identified as 'Traditional' (7% more), 'Secular' (11% more) and 'Haredi' (4% more) in the Gen 17 survey compared to the Shalom 2021 Survey. In the Shalom 2021 survey more respondents identified as 'Just Jewish' (11% more), 'Progressive' (4% more) and 'None of the above' (5% more) than the Gen 17 survey.


Note: Respondents to the question 'Do you identify as any of the following?' were presented with five different options.

  1. I have a strong Jewish identity, the majority of my social network is Jewish, and I am actively involved in helping create a strong and vibrant Jewish community.

  2. I have a strong Jewish identity, the majority of my social network is Jewish, but I am not actively involved in helping to create a strong and vibrant Jewish community.

  3. I have a Jewish identity, the majority of my social network is not Jewish, and I am not involved in actively creating a strong and vibrant Jewish community.

  4. My Jewish identity is not a major factor to my life, the majority of my social network is not Jewish, and I only get involved in Jewish activities if they align with my interests or passions.

  5. My Jewish identity is not a major factor to my life, the majority of my social network is not Jewish, and I am not involved in Jewish activities.

Shalom Annual Report 2021 —

Outcomes

Survey respondents moved a slider to indicate whether they agreed or disagreed with the included dimension statements in relation to the event. The first tab chart contains the response data for 'public' responses, showing the average result for each dimension.

The second tab shows the interquartile range of responses for each dimension. These ranges represent the middle 50% of responses, which are areas on the slider where most responses typically fell. Accompanying this range is the median result for each dimension (i.e. the most common response). Smaller ranges indicate similarity in agreement between respondents, whereas larger ranges indicate a wider spread of responses.

The Culture Counts platform provides various methods to capture survey responses at a minimal marginal cost. Achieving larger samples enables organisations to be more confident about the average results and that opinions of the survey respondents are representative of all attendees. The accompanying margin of error chart shows the expected differences for the associated dimension results calculated at a 95% confidence level.

Outcome Averages

Loading...
Loading...
Loading...
Loading...

Insights

The highest scoring dimension was 'Concept' (82/100), this was followed by 'Heritage' (80/100), 'Inclusion' (76/100) and 'Meaning' (72/100). This suggests that respondents were likely to agree that the idea/program was interesting, that it made them feel connected to a shared history/culture, that it made them feel welcome and included and that it moved and inspired them. Although still receiving positive results, the lowest scoring dimensions were 'Insight' (69/100) and 'Relevance' (65/100). Respondents were less likely to agree that the program helped them to gain new insight or knowledge or that it gave them a better understanding of today's world.

'Concept' had the smallest interquartile range and highest median score (84/100) suggesting that respondents were consistently likely to agree that it was an interesting idea/program. 'Insight' had the largest interquartile range and the second lowest median score (73/100) suggesting respondents were less likely to agree that the program they attended helped them gain new insight or knowledge and that their responses were more varied.

At a 95% confidence level, the margin of error for dimensions ranged from 2.0% to 2.7%. This means that we can be 95% confident that if we surveyed the entire audience, the average outcome for 'Concept' would fall within 2.0% of the average results generated by the sample.

Shalom Annual Report 2021 —

Shalom Metrics

Three custom metrics were added to the Shalom evaluation. These metrics were:

  • Vibrancy: Shalom enhances the overall vibrancy of the Sydney Jewish community

  • Connection: Shalom helps me feel connected to people in the Sydney Jewish community

  • Engagement: Shalom programs enhance my engagement with the Sydney Jewish community

Survey respondents moved a slider to indicate whether they agreed or disagreed with the included dimension statements in relation to the event. The first chart shows the average result for each dimension.

The second chart shows the interquartile range of responses for each dimension. These ranges represent the middle 50% of responses, which are areas on the slider where most responses typically fell. Accompanying this range is the median result for each dimension (i.e. the most common response). Smaller ranges indicate similarity in agreement between respondents, whereas larger ranges indicate a wider spread of responses.

Loading...
Loading...
Loading...

Insights

'Vibrancy' was the highest scoring custom dimension (73/100), this was followed by 'Connection' (68/100) and 'Engagement' (66/100). This suggests that respondents were likely to agree that Shalom enhances the overall vibrancy of the Sydney Jewish community. Although still a positive result, respondents were less likely to agree that Shalom helped them to feel connected to people in the Sydney Jewish community or helped to enhance their engagement with the Sydney Jewish community.

The interquartile range was very similar across all three metrics, suggesting there was a similar amount of variance in agreement level across each area. However, the median scores followed the same pattern as the average results with 'Vibrancy' receiving the highest score (74/100), 'Connection' having a median result of 70/100 and 'Engagement' receiving 66/100.

Shalom Annual Report 2021 —

Net Promoter Score

Respondents were asked whether they would recommend Shalom to a friend or colleague. Respondents could choose a number from 0 to 10 from a menu, with 0 meaning 'not likely at all' and 10 meaning 'extremely likely'.

These results can be used to calculate a Net Promoter Score (NPS). NPS is a standardised metric that seeks to measure loyalty between an organisation and its audience. Respondents with a score of 9 or 10 are considered 'Promoters'. 'Detractors' are those who respond with a score of 0 to 6. Scores of 7 and 8 are considered 'Passives'.

NPS is calculated by subtracting the percentage of respondents who are Detractors from the percentage of customers who are Promoters. This means that an overall Net Promoter Score can range between -100 to +100.

This chart shows the proportion of respondents that would or would not recommend Shalom, followed by the calculated NPS below.

Loading...
Loading...
Loading...
Net Promoter Score: 14

Insights

Overall, 39% of respondents scored either 9 or 10 indicating they would be classified as Promoters, 35% of respondents scored passive results (7 or 8) and 25% would be considered detractors (scoring between 0-6).

A NPS that is positive (i.e. higher than zero) is felt to be good, and a NPS of 50+ is excellent. Shalom's NPS of 14 is good and shows that attendees are likely to recommend Shalom programs to friends and colleagues.

Shalom Annual Report 2021 —

Perceptions & Behaviour

Shalom Connection

Respondents were asked a number of questions relating to their connection to Shalom. The first chart shows responses when respondents were asked if they actively look for communal events to fill their social calendar. The second chart demonstrates the extent to which respondents felt Shalom programs have affected their personal importance of being Jewish.

The third chart shows the impact Shalom has had on respondents' connections within the community. The fourth chart indicates how Shalom has been able to enhance inclusiveness in particular areas.

Loading...
Loading...
Loading...
Loading...
Loading...
Loading...
Loading...
Loading...
Loading...
Loading...
Loading...
Loading...

Insights

When asked if they look for communal events to fill their social calendar, the majority (45%) of respondents answered 'Somewhat', a further 35% answered 'No', 18% answered 'Yes' 1% said they did not know. Suggesting that overall, 63% of respondents look for communal events to fill their social calendar.

Although 60% of respondents indicated that there had been no difference in how important being Jewish felt to them since they attended their first Shalom program, 33% indicated that being Jewish had become more important to them and only 1% said that being Jewish had become less important to them, which is a very positive result. 6% did not know how they felt in response to this question.

The majority (31%) of respondents indicated that Shalom had impacted the social connections they had made within the community. A further 11% indicated that Shalom had impacted their professional connections, 7% said it impacted their romantic connections and 7% experienced an impact on other connections within the community.

The majority (59%) believed Shalom enhanced the inclusiveness in religious divisions, 51% believed it enhanced the communal involvement of young Australians and 38% indicated that it enhanced division between Jewish immigrants and Australian born Jews. 37% believed Shalom enhanced alternative attitudes towards Israel, 35% towards the LGBTQI+ community and 31% towards interfaith couples.

Shalom Annual Report 2021 —

Wider Community

The following charts show the results of questions related to the wider community. The first chart shows the level to which respondents feel the Sydney Jewish community is inclusive. The second chart shows how much respondents' Jewish knowledge of ideas or rituals has been enhanced since they attended their first Shalom program. The third chart displays what elements respondents believe should be included and explored in Shalom's programs and events.

Loading...
Loading...
Loading...
Loading...
Loading...
Loading...
Loading...
Loading...
Loading...

Insights

When asked if they believed the Jewish community is inclusive the majority (47%) of respondents answered 'Somewhat' and 26% answered 'Yes', suggesting that overall 63% of respondents believe the Sydney Jewish community is inclusive. 10% answered no to this question and 17% did not know how they felt.

33% indicated that their Jewish knowledge of ideas or rituals was somewhat enhanced since attending their first Shalom program and a further 32% confirmed that it had been enhanced, an excellent result. 27% suggested that their knowledge in this area had not been enhanced and 8% were unsure.

The majority of respondents indicated that learning about Jewish cultural experiences (75%), Jewish history (70%) and Jewish values (supporting social and justice issues) (70%) were important elements of Shalom's programs. Respondents also believed that Jewish values (upholding strong moral and ethical behaviour) (68%), rituals (festivals) (58%) and Jewish values (charity and volunteering for charity) (58%) were important elements of Shalom's programs and events.

Shalom Annual Report 2021 —

Comparison & Benchmarks

2020 Survey Comparison

Respondents to the 2021 survey were asked if they had completed the survey for Shalom in 2020. The responses from those who indicated that they did complete the 2020 survey have been compared to the 2021 results for other comparative questions.

This comparison serves as a proxy for identifying changes in responses to questions about Community and Connection between 2020 and 2021.

Loading...
Loading...
Loading...
Loading...
Loading...
Loading...
Loading...

Insights

Only 10% of respondents recalled completing the 2020 survey. The majority (47%) could not recall if they had completed the previous survey. The following insights therefore represent this 10% of respondents for 2021.

44% of respondents felt that being Jewish had become more important after attending their first Shalom program in 2021, compared to 30% in 2020, which is an excellent result for Shalom. No respondents across either year indicated that being Jewish had become less important to them.

The results suggest that in 2021 respondents believed that the Sydney Jewish community was more inclusive than in 2020. In 2021, 85% of respondents agreed (35% answered 'yes' and 50% answered 'somewhat') that the Sydney Jewish community was inclusive compared to 72% of respondents (25% answered 'yes' and 47% answered 'somewhat') in 2020, an excellent result.

In 2021, 80% of respondents felt their Jewish knowledge of ideas or rituals had been enhanced since attending their first Shalom program (48% answered 'yes' and 32% answered 'somewhat'), compared to 62% (29% answered 'yes' and 33% answered 'somewhat') in 2020, which is a positive improvement. There were also fewer respondents (20%) who felt their Jewish knowledge of ideas or rituals had not improved in 2021, compared to 30% in 2020.

In terms of how Shalom impacted connections within the community, results were very similar between 2020 and 2021 with there being no more than 3% difference for all options, apart from 'Social' where there was a 13% (31% to 44%) increase from 2020 and 2021. However, overall the 2021 results were consistently the same or higher than the 2020 results for each connection area.

In terms of inclusivity, respondents indicated that Shalom had further enhanced inclusiveness in all areas apart from 'Alternative attitudes towards Israel' (decrease from 51% to 41%) between 2020 and 2021. Improvements ranged from 1% ('Disbabilities') all the way to 20% ('Religious divisions'), which is an excellent result. This suggests that Shalom did exceptionally well in terms of enhancing the inclusiveness of religious divisions, however, they could work to enhance inclusiveness surrounding alternative attitudes towards Israel.

The majority of the community and connection areas improved between 2020 and 2021, which is an excellent result for Shalom.

Shalom Annual Report 2021 —

Comments and Feedback

Sentiment Analysis

Respondents were asked to leave any additional feedback about their experience at Shalom. This feedback has been classified into positive, neutral, or negative categories, with the percentage of feedback sentiment types presented in the following chart.

Loading...

General Feedback

Feedback helps organisations understand where the value of visitor experiences lies and how they can be improved and strengthened in the future. A selection of comments have been highlighted underneath.

"Thank you for providing us with Jewish-enhancing experiences via different, fascinating platforms."

"We loved the indestructible book - my 7 month old is obsessed with it! Thanks for all the wonderful books this year, our family has loved reading & sharing them <3"

"We have only been made aware of the monthly Jewish books that we receive; which are fantastic! If there are other activities or programs that we can be involved in, we'd love to know about these. My kids also particularly enjoy little gifts they receive such as the apron for cooking or something for Chanukah we once received etc.. It brings a little of the traditions into the house rather than just reading about them..."

"I enjoy reading the stories and they enjoying reading it too."

"Pj library has been 80% of my kids learning about Judaism over the past year- I have recently been reflecting by re-reading all the books we have- and am overwhelmed with gratitude for how much knowledge, tradition and beautiful story telling it has brought to my two kids lives, as well as educating me too."

"PJ library is the only Shalom program I'm currently engaged in, and my children love most of the books. It keeps them informed about Jewish culture and festivals, as well as worldwide Jewish customs."

"I would like to see a means of getting young unaffiliated Jews 30's to 40's to be able to get together who find the community quite cliquish and not welcoming of shy individuals."

"I am a young new member of the Sydney Jewish community from the US and find it very hard to break into this insular and exclusionary crowd - would be great to have more opportunities to meet people who want to meet people."0

"Movie or theatre groups and discussions - art tours"

"I would have like some activities for the over 65 that are engaging."

"We need a communal calendar of events."

"Am disappointed with lack of contact from/about Jewish Writers Festival."

"To keep on improving the many aspects of it. And consider older participants, such as myself, who have no need to improve their very Jewishness. Your aim is wholly for the young ones."

"Not enough Mid East/ Israel socio political lectures/ webinars as there used to be for the over 65 age group."

Shalom Annual Report 2021 —

Connection Stories

Respondents were asked how Shalom programs help them to feel connected to people in the Sydney Jewish community. Some of their responses are listed below.

Can you tell us a little more about how Shalom programs help you feel connected to people in the Sydney Jewish community?

"In COVID times, zoom lectures, SJWF, Limmud oz reduced feelings of isolation from community and enhanced connectedness with the Sydney Jewish community."

"just good to know what is happening in the community and i can pass on relevant information to various family members."

"I really enjoyed being part of the community - it's actually new for me as I had not really connected strongly with my Judaism for some time."

"See people who share similar interests but with whom don't normally actually socialise."

"It is a wonderful idea for our 2 cities of Melbourne and Sydney to be more connected - especially if we can bring the younger generation to be in touch with each other as well."

"It was an informal way to meet likeminded people with a mutual interest."

"We loved reading books and discussing them with our jewish friends."

"The adamama junior playgroup is such a fantastic initiative- I think it's fantastic to combine Jewish values with gardening."

"Brought together a new group of people that I otherwise wouldn't have been around."

Shalom Annual Report 2021 —

New Ideas

Respondents were asked to give suggestions of programs or activities that they would like Shalom to develop. Some of their ideas are listed below.

Do you have any ideas of programs or activities that you would like to Shalom to develop?

"Get togethers for Jews 70+"

"I would like to see more activities related to Yiddish."

"Communal dinner e.g.shabbat."

"I'm not sure if there are any in Melbourne for school aged kids in Primary school, the few jewish programs I have looked into have all been Jewish history together with Hebrew. I'd love to find a program for my kids that's all about our Traditions where they can interact with other jewish kids but not interested so much in them learning the actual language (at this stage in their life)..."

"Jewish cooking events parents and children."

"I would love more activities for families run on weekends - or at times parents in full time work could attend."

"Any activities out of Sydney, our family is in the blue mountains, and my daughters class includes four Jewish kids and a Jewish teacher. I wish we could be more included without driving into the city."

"Help cultivate stronger bond between grandparents with grandchildren outside families only."

"Craft / baking / sport family days / candle sticks making / make a challah cover"

Shalom Annual Report 2021 —
Data and Insights by
Report prepared for

This report has been prepared by Jordan Gibbs, Jack Midalia and Rosie Tooby of Culture Counts. The authors would like to thank all stakeholders and staff for their participation in this research.

Approved by: Jordan Gibbs.
Date of Approval: 28 February 2022