
Our outcomes evaluation thinking is designed around ‘Six Steps’ – our Theory of Change methodology we are passionate about. Why?
The ‘Theory of Change’ is a recognised framework that explains the cause-and-effect relationship between your strategy, activities and their impact. It’s in the name – what’s your theory about how you will create change? Developing your own Theory of Change can enable you to constructively:
- Identify what your organisation is trying to achieve (outcomes)
- Consistently test, measure and analyse your success at realising those outcomes
- Make informed decisions about how to improve the ways you affect change
- Gain a better understanding on what your audience thinks
- Produce richer stories about your impact and value
- Engage sponsors and stakeholders by also understanding their outcome priorities
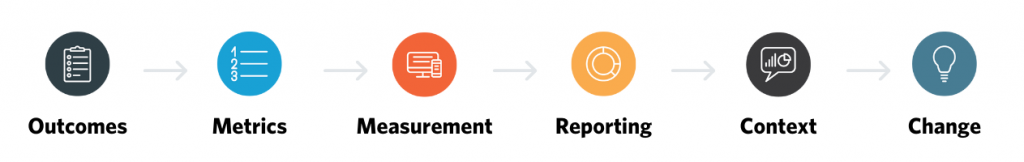
Culture Counts’ Six Step Evaluation Process is the way we try to help you implement Theory of Change thinking into your strategy and decision-making.
The process is centred around outcomes evaluation – designed to help you clarify your outcome priorities by defining your strategic goals by the outcomes they are trying to achieve. Outcomes-evaluation can help you:
- Gain a better understanding on what your audience thinks
- Produce richer stories about your impact and value
- Engage sponsors and stakeholders by also understanding their outcome priorities

Step 1
Outcomes – measure what matters
It all starts here. What is your organisation’s vision and how do you plan to achieve it? How can you ensure that your programs or activities create the change that you hope for?
By identifying what matters to your organisation, you can start the process of setting up your evaluation strategy. We suggest going through a Strategic Alignment process, by linking your goals to an outcomes framework. Sometimes different goals have similar outcomes. For example, ‘delivering for the community’ and ‘maintaining high standards of excellence’ can contribute towards the same outcome, which could be ‘generating community pride’. Understanding these links will set you up for metric selection (the next step). When thinking about outcomes, we think about the ‘change’ we are creating. Here are some examples:
- A library may have the goal to deliver education programs that promote lifelong learning
- An arts and cultural organisation might aim to present works that stimulate creativity in young people
- A government organisation may have a goal to help its community feel safer through place activation

Step 2
Metrics – ask the right questions
So, you’ve identified your outcomes. The next step is to identify the metrics you’ll use to measure their realisation. Create an evaluation plan and choose questions that speak directly to your goals and outcomes.
Culture Counts gives users access to 100+ standardised outcomes metrics, known as ‘dimensions’, that have been developed through extensive work with the sector. We categorise our metrics as cultural, social, civic, place-based, economic and quality outcomes.
Metrics can be chosen to suit your specific need or context and they use standard language that allows for events to be benchmarked nationally and internationally and for performance to be tracked over time. When you ask the right questions, you can use results to get a true understanding of your organisation’s unique impact and use this evidence to drive better outcomes.

Step 3
Measurement – deliver great survey experiences
It’s now time to build your survey and start collecting data.
Depending on your audience and the design of your survey, you may choose to collect data via an online survey link, face-to-face using a tablet, or via a permanent tablet display. Here are some questions to consider when determining best method of distribution. Do you have access to customer email addresses? Do you have the resources to approach audience/participants with a face-to-face survey? Do you have a foyer or front desk that can facilitate a display?
The user’s survey experience is also important to consider. How are the questions displayed? Is it easy to provide feedback? Does the survey experience promote quality feedback? Considering these scenarios can empower you to create and deliver effective surveys.
The user-friendly Culture Counts survey builder gives you the freedom to build and customise surveys, distribute surveys optimised for desktop and tablet displays to capture meaningful results online or face-to-face. You can also use our pre-built templates to get yourself started!

Step 4
Reporting – understand and share your results
The data has been collected, but how do you make sense of it? One of the best ways to turn raw data into meaningful information is to use charts. Visually presenting your data is also an awesome way to tell a story and engage your supporters.
The type of charts you use can be determined by the complexity of the question and the story you want to present. We like this useful guide from Good Charts[1] referencing Andrew Abela’s Chart Type Hierarchy (p. 83):
- Comparison charts can be used to display many items or items across time. Common types can include bar and line charts.
- Composition charts can be used to display items statically or across time. Common types include stacked bar and pie charts.
- Relationship and Distribution charts can be used to display single to three or more variables. Common types can include scatter and histogram charts.
[1] Scott Berinato, 2016. Good Charts, The HBR Guide to Making Smarter, More Persuasive Data Visualizations. Harvard Business School Publishing Corporation, United States of America.

Step 5
Context – gain deeper insights
You’ve reported your results – but how do you compare? Are you meeting industry expectations? By using standardised outcome metrics, you can better track and benchmark your progress over time and across industries. Benchmarking can play an important role in providing a:
- Macro-view of opportunities and threats
- Creating a collective voice for your sector

Step 6
Change – use data to make decisions
The work you’ve undertaken in Steps 1 – 5 are leading to this big moment. Using your data to make decisions and implement change. So, how did we get here? Let’s use our library example:
Step 1: Outcomes. Measure what matters
A library wishes to measure the impact of its Education programs in delivering life-long learning skills to participants.
Step 2: Metrics. Ask the right questions
To gain appropriate feedback regarding the “life-long learning” aspect of the programs, and to compare the feedback across libraries, the Culture Counts’ Learning dimension (“I learned something new”) was included in the survey.
Step 3: Measurement. Deliver great survey experiences.
The library distributes the survey to participants who have engaged with the education programs online and face-to-face encouraging quality data collection.
Step 4: Reporting. Understand and share your results.
The library generates reports, comparing the outcome of “life-long learning” across variables including age and background. The library shares its reports with internal and external stakeholders – to highlight the achievements and opportunities for improvement.
Step 5: Context. Gain deeper insights
The library compares its results across other libraries for an additional layer of context. How does it stack up against other libraries in the area, or in the country? Do the results meet expectations? Accessing a shared pool of information may highlight the need of the library to seek further support for its education programs.
Step 6: Change. Use data to make your decisions.
The library uses data insights to implement changes to improve the outcome of “life-long learning” – perhaps changing the course to provide more skills, seek more funding to support the increase in demand, or reallocate resources to a program that resonates better with the users.
The Six Step Evaluation Process is an effective solution to help you effectively act on your data. If you are interested in finding out how Culture Counts can help you achieve this get in touch with one of our friendly Client Managers.