How does your organisation’s audience experience compare to the rest of the sector?
In 2025–26, Culture Counts subscribers across Australia, New Zealand and Asia collected feedback from 138,874 survey respondents – arts attendees, participants and artists alike. Our latest Benchmark Report brings that data together, giving organisations a way to see their own results measured against a national and international cohort of similar organisations, and against the broader arts ecology they’re part of.
Inside the Report
This year’s snapshot draws on 941 surveys from 116 organisations across the cultural sector, giving us a comprehensive pictures of how audiences experience arts and culture.
You can explore the findings by overall results, or dive into the segments that are relevant to you.
- Cultural Institutions
- Performing Arts
- Festivals
- Support Organisations
Across every segment, the report unpacks demographics, how attendees found out about the event or activity, what their experience was like and how each organisation performed across the key dimensions the sector uses to measure impact.
Some standout results from this year’s most commonly used dimension statements, by domain:
| Domain | Dimension | Statement | Median |
|---|---|---|---|
| Cultural | Meaning | It moved and inspired me | 81/100 |
| Social | Access | It gave me the opportunity to access activities I would otherwise not have access to | 80/100 |
| Community | Belonging | It helped me feel part of the community | 79/100 |
| Economic | Diversity | It engaged people from different backgrounds | 79/100 |
| Placemaking | Vibrancy | I enjoy the vibrancy and activity here | 88/100 |
| Qualities | Cultural Contribution | It provides an important addition to the cultural life of the area | 89/100 |
Other Highlights
Across the dataset, the overall experience score reached 96%, with a Net Promoter Score of 65. Support Organisations recorded the highest overall experience rating at 97%, with Performing Arts organisations receiving a Net Promoter Score of 67.
- Across the different arts and cultural segments email was the most commonly cited marketing channel
- Social media was the top channel for Festivals at 56% and word of mouth for Cultural Institution at 44%
- Audiences at First Nations events and programs gave a Net Promoter Score of 73
- Overall, 74% of respondents were female
- Respondents aged 60+ made up 52% of the overall sample
Using the Benchmarks
For individual organisations, these results are a way to see how a result for dimensions like ‘Meaning’ or ‘Vibrancy’ compares to similar institutions, festivals or performing arts companies across the region. The report also allows organisations to gain confidence in choosing the right metrics, compare against their own past results, and set KPIs for the coming year.
Click here to access the report, or contact us to discuss incorporating benchmarks into your insights reports.
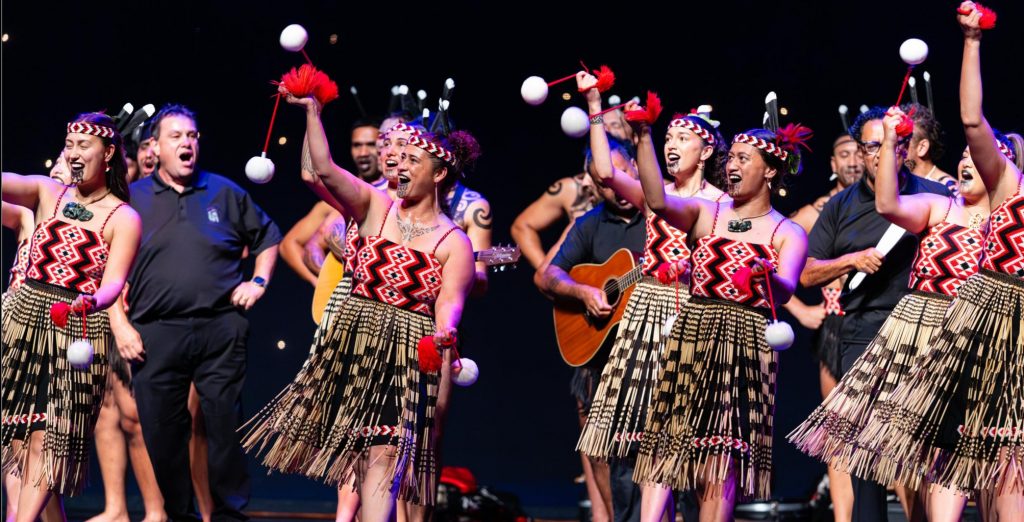
Image: Auckland Arts Festival — Photo: LK Creative