
On 16 April 2020 Indigo-Ltd and 192 cultural organisations distributed a COVID-19 audience survey in the UK, capturing over 86k responses.
In partnership with Indigo-Ltd, Culture Counts ran statistical analysis on the big data captured to offer a breakdown of organisations can use this data. We hope that this analysis will complement the initial analysis and other research happening in the sector. We recommend looking at the original report available here.
What are audiences thinking?
One of the toughest challenges for organisations to plan for is the demand for their services in a post-COVID-19 world as we all try to progressively return to normal life. The diversity of the cultural sector and of its audiences mean that when thinking about audience behaviour, we believe that unique insight is derived from the differences found in survey results.
Download the After the Interval COVID-19 UK Audience Impact Survey Snapshot
Factor analysis
Overall Factor Analysis: What factors have the strongest influence on how respondents answered?
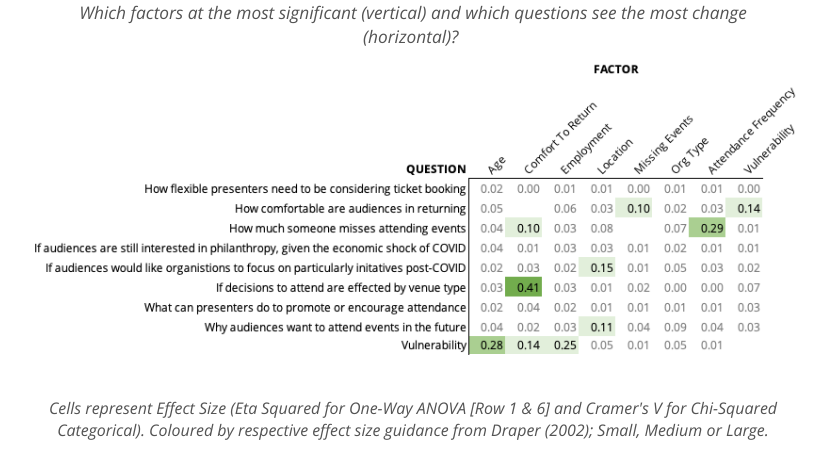
The following matrix maps the ‘effect size’ caused by every factor in the survey, compared to the question being asked. The bigger the number, the more difference we see in the results.
What results matter?
All survey responses matter, however when using data to plan and make decisions the question is a statistical one – are the aggregate results representative of my audience? The factor analysis tells us where the differences are in the aggregate results and where to find them.
For example, a math class might get an average of 80/100 for a test but the factor analysis tells us there is a big difference caused by gender. We investigate to discover the average for boys was 70/100 and the average for girls was 90/100. This means that if an entirely different class does the same test, we will expect the overall average score to change based on the ratio of boys to girls in that class. More boys means the average score is lower; more girls means the average score is higher. It is the same for audiences. For some questions, the results are broadly the same for all audiences. However, for others, we see some bigger differences.
This analysis showed three medium or large differences:
- Someone missing attending events, based on how frequently they attended events before.
- The types of venues people will be comfortable in returning to, based on how comfortable they are in returning to normal life after COVID-19.
- Vulnerability effects comfort to return and older audiences are more likelihood to be vulnerable to COVID-19, but age does not significantly affect someone decision to attend events in the future.
Regular attendees
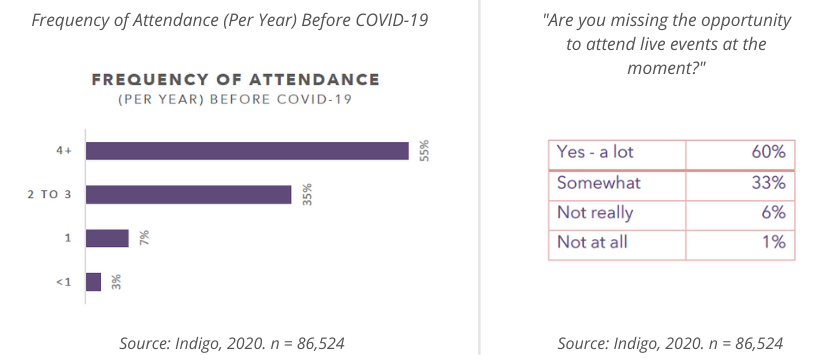
The survey collected the majority of responses from those that would be considered as frequent attendees. Generally, this is not a problem when analysing survey results, as the factor analysis shows. It did cause a significant difference in the results of one question in the survey regarding how many attendees missed events.
The implications of this problem are explored further in the Selection Bias section.
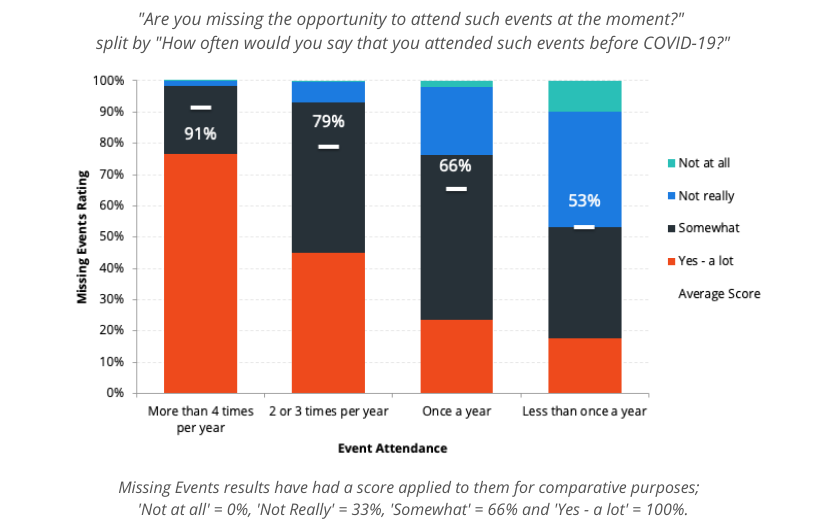
Those that attended events – frequently miss them the most. Those that attend infrequently – miss events significantly less. This is important because for many organisations, a large selection of their audience are considered ‘single ticket buyers’. It still appears that infrequent attendees miss events at a 50/50 split.
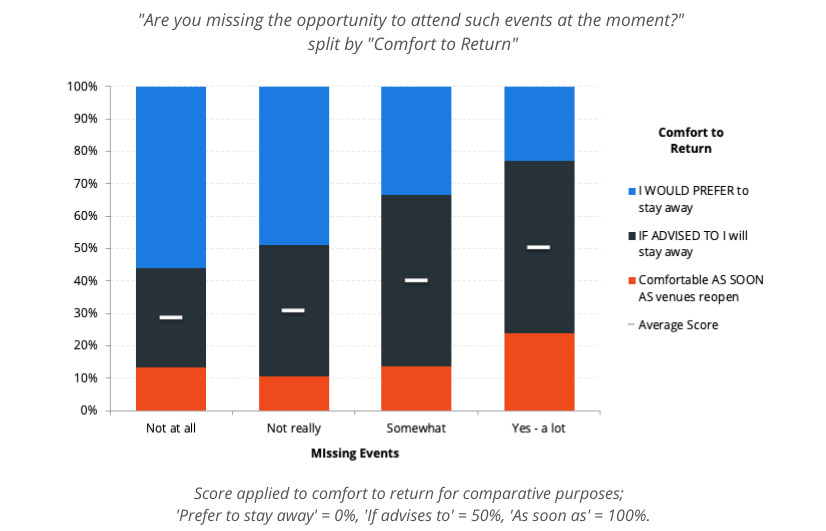
The question then follows if missing events affects someone’s comfort to return. A cross-tabulation of audiences that miss events by their comfort to return found that those that do not miss events are likely to stay away longer. The analysis determined this to be a small effect, likely because of the small promotion of attendees that did not miss events (approximately 7%). For this reason, it is uncertain if this result represents the entirety of the audience, and will likely have larger implications for organisations with a high proportion of audiences that infrequently engage with arts events.
Venue Type
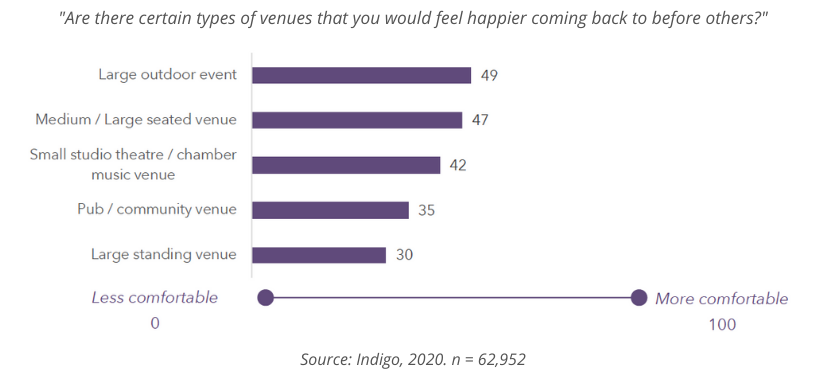
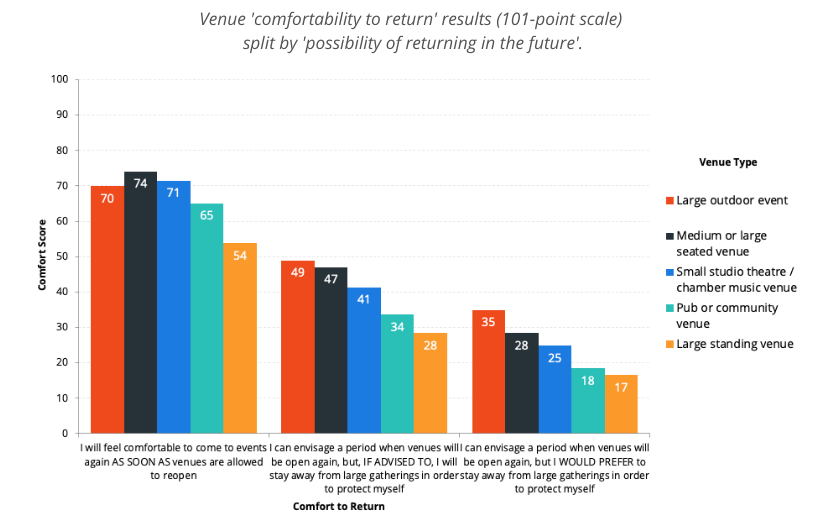
Respondents were asked to rate how comfortable they would be to return to events, based on five different venue types. They using a continuous slider to input their results. When averaged, no venue performed positively. However, when the results were split by how comfortable someone was to return in general, the scores varied significantly.
This revealed that comfort to return has a large effect on the score an individual gave to a venue type, however, generally all scores followed this average trend of placing large outdoor areas and seated venues as the most popular.
Vulnerability to COVID-19
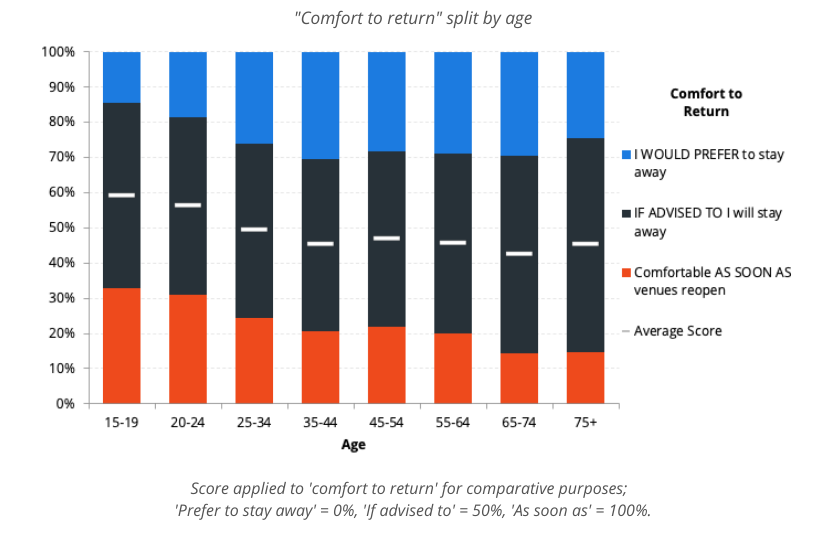
Age and artform type have negligible effect sizes on respondents comfort to return, however, vulnerability does have a small effect on someone’s comfort to return.
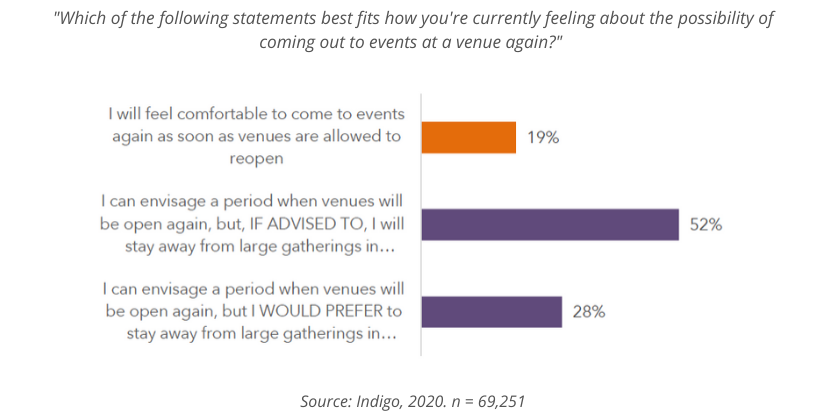
Regarding ‘comfort to return’, most respondents will follow public advice regardless of their vulnerability to COVID-19. The difference is predominately in the groups that are either comfortable to return now or plan to stay away longer. Those that are comfortable to return now are more likely to not identify as vulnerable, whereas those that are likely to stay away longer do identify as vulnerable.
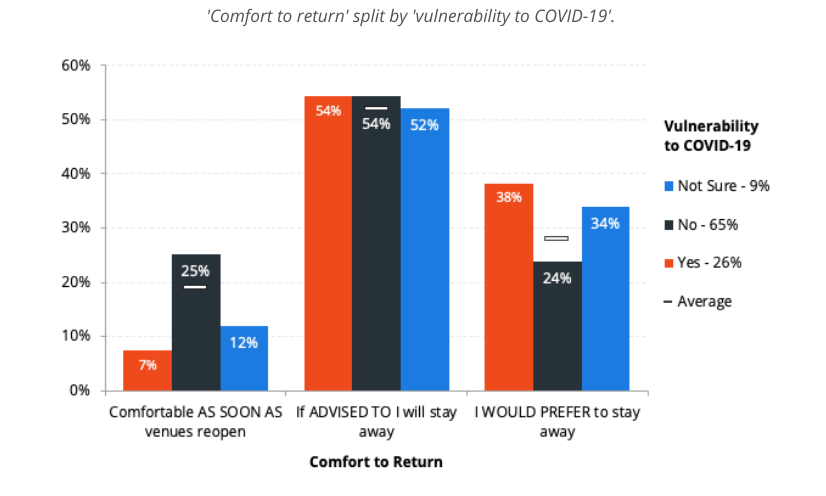
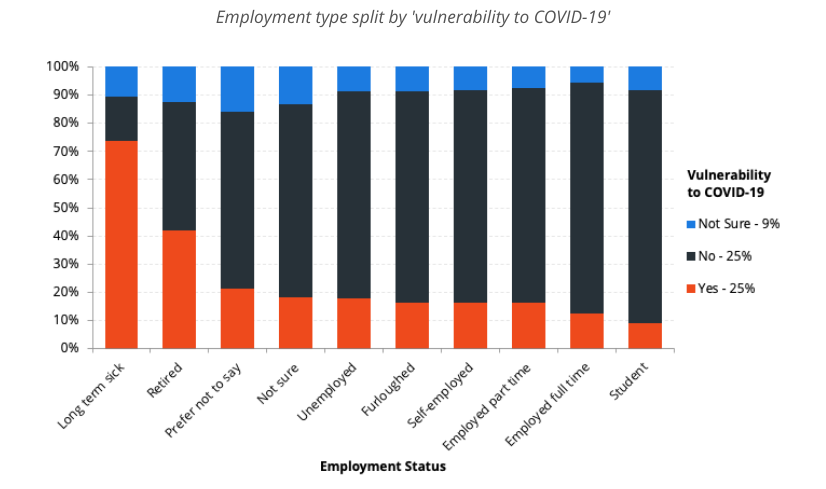
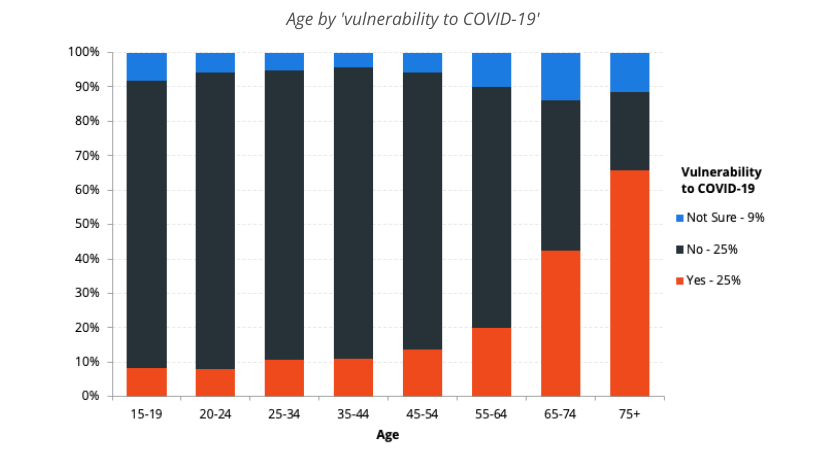
When looking at vulnerability, the factors of age and employment status do have medium effects on whether someone identifies as vulnerable or not. Older respondents are more likely to identify as vulnerable to COVID-19, as are those who have long-term sickness or are retired. However, because of the significant portion of respondents who plan to follow government advice, these effects only translate into a small comfort to return by age, with most respondent age brackets reporting similar results.
Other factors
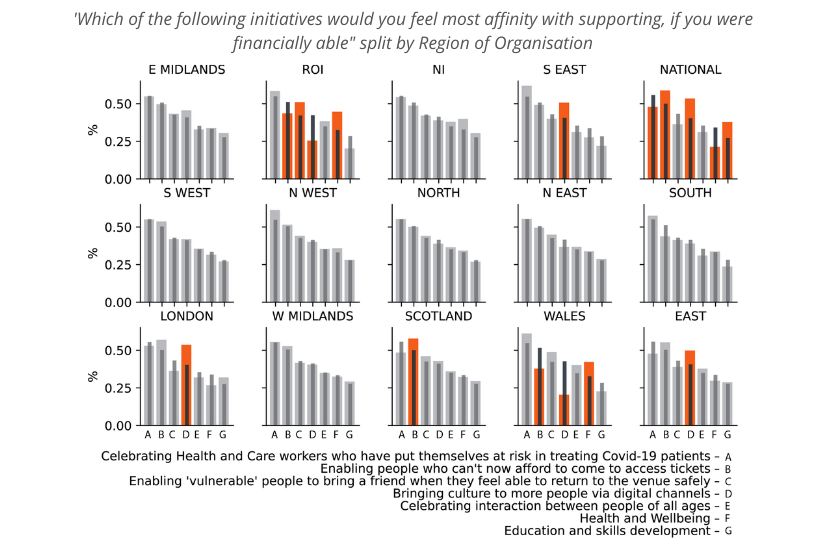
Generally speaking, the effect size of the other factors considered was relatively small or insignificant. If these were the only factors that were important in determining someone’s response (which may not be the case), given the small effect sizes, this helps us to be confident in using the overall results for planning and decision making. For example, when splitting results for respondents that are interested in particular initiatives split by region, we believe there is less value for most organisations to consider the differences in the result, however, there will be notable exceptions.
Regarding support for particular initiatives by region, most respondents follow the overall average and trends for all the options. There are a few examples of regions that deviate from the norm, particularly responses for national organisations and those based in the Republic of Ireland.
This is visualised below. The large bars represent the regional average response. Black bars represent that overall average response. Orange bars represent results of significant difference.
Selection bias
Generally, when we see factorial differences like these, we apply a ‘weighting’ to the results to come up with an overall result that is representative of an entire population. A major difficulty we find with posthoc surveys, especially in the cultural sector, is selection bias. As arts attendees tend to be highly engaged, they also tend to be over-represented in survey results. The After the Interval survey deliberately targeted engaged audiences to get an understanding of the scale of impact for organisations. As the factor analysis demonstrates this approach is generally not a problem since engaged attendees do not normally skew the results away from the overall average. The results highlighted here are the exception to that.
This has two implications:
- The overall results for these questions may not be representative of the general population
- Organisations should be considered in using these results for their own decision-making
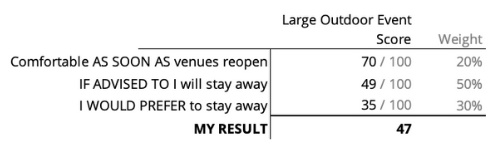
If you want to use this data in your own forward planning, we recommend applying a weight to these results, based on what you think your overall audience looks like. For example, if you take the scores for your venue type (e.g. large outdoor events) and estimate the breakdown of comfortability for your audience, you can determine your individual score. In the below example, the weighted score is 47/100 (70 * 20% + 49 * 50% + 35 * 30%).
Conclusion
The After the Interval survey offers cultural organisations a unique approach in collaborating to understand the complexity and diversity of our audiences and how they are responding at this moment. In combining our resources and sharing information, we are better able to understand what response we can make jointly as a sector and where it is important to differ, based on our respective communities of interest.
As more questions emerge, we will continue to revisit this analysis as we progress through this pandemic.
Appendix – Methodology
Using the After the Interval survey data provided by Indigo-Ltd, we designed an analysis framework to understand how certain factors influenced the results of the questions being asked.
The primary questions in the survey were
- How much someone misses attending arts events
- Why audiences want to attend events in the future
- How comfortable audiences are in returning
- What can presenters do to promote or encourage attendance
- If peoples decision to attend will be based on the venue type
- How flexible presenters need to be considering ticket booking
- If audiences are still interested in philanthropy, given the economic shock of COVID-19
- If audiences would like organisations to focus on particularly initiatives post-COVID-19
- What percentage of audience believe they are at high risk and vulnerable to the effects of COVID-19
When considering these questions, we consider the following factors to see if they make any difference in the response
- Age
- Employment Status
- Vulnerability to COVID
- Regularity of Attendance
- If they miss attending events
- How comfortable they are in returning to events post-COVID-19
- Where the organisations was based (i.e. region)
- What type of arts organisations sent them the survey (i.e. org type)
We generally find in our audience research that everyone’s audience is slightly different. When we consider our main questions and the factors that can alter the results we can see where we need to have a diversified response to help our audiences engage with us again.
Indigo-Ltd conducted the Act 2 survey with cultural organisations in the UK. More information is available here and the initial results are available here. This analysis was conducted by Culture Counts in partnership with Indigo-Ltd.
Culture Counts provides online evaluation solutions for measuring impact.
