
Over the past six years, Culture Counts has conducted over 400 economic impact studies to quantify how audience spending at events and activations contributes to the local economy. Business Development Director, Jordan Gibbs, explores Culture Counts’ methodology for measuring economic impact and reveals the average results we’ve seen to date.
During the early stages of the COVID-19 pandemic, we worked with Performing Arts Connections Australia (PAC) to help quantify audience spending in their local economy when they attend performances and events. This research was used as part of the sector’s larger advocacy efforts in 2020. As a followup to that research, this blog summarises the results of 410 economic impact studies conducted by Culture Counts over the past six years.
Economic Impact Assessment (EIA) is something we frequently conduct at Culture Counts. One of the complicated aspects of economic impact is that there isn’t a standard approach applied to the concept. We discussed this in mid-2020, in regards to many different factors applied to the economic impact of the cultural sector. Watch the full web series here
As a way to address this challenge, Culture Counts uses a flexible methodology that suits multiple stakeholders interested in the economic impact of culture and cultural events. One of the main questions we use in our methodology is to ask attendees how much money they spend directly before or after attending an event. We do this to calculate a ‘direct event spend’ figure, which is the spending that goes into a local economy that the event provider would not be able to calculate independently.
One note about ‘direct event spend’ in our methodology – we specifically asked respondents to exclude spending on major items like ticketing or accommodation and travel (we address accommodation and travel spending in separate questions). This is because when it comes to event spend, we try to control for factors that influence the spending figure so we can get a real sense of how an event interacts with its local economy.
Why is this important? Because it makes our data more consistent and helps data-driven decision making. For example, one insight from our evaluation of a major outdoor event showed that local spending was actually suppressed by the event’s site layout. When we evaluated and compared spending results in the following year (with a new site layout), the direct event spend figure increased by over 40%. If that average spending figure had included accommodation and travel spending, then it would have been difficult to know if the increase was due to the site layout change, or due to the reduction in international travel to the event caused by unforeseen circumstances, such as the COVID-19 pandemic.
Reducing the influence of factors like these is part of a larger area of research design called ‘internal validity and is very important when it comes to being confident about your research findings. With this in mind, what can the aggregate dataset of Culture Counts’ Economic Impact Assessments tell us?
As of March 2021, we had conducted 410 Economic Impact Assessments collecting 94,540 responses over 5 years. A summary of these results at both the survey and respondent level are shown below.
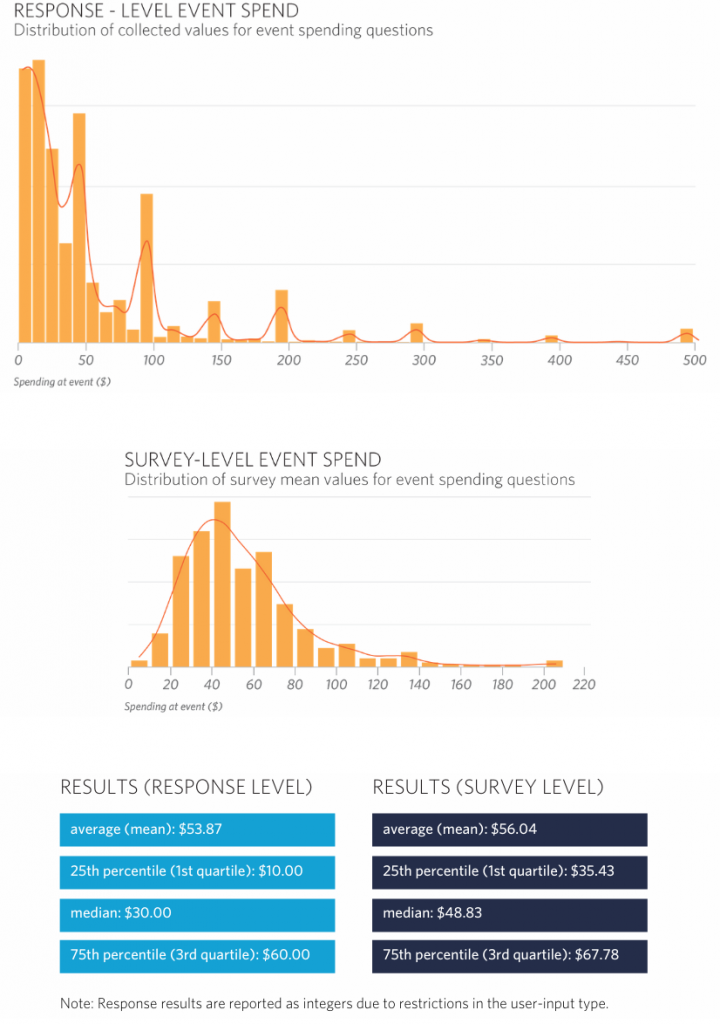
When it comes to individual responses for our ‘direct event spend’ question, the median response to questions about how much spending occurs before or after attending an event is $30. The average result is influenced more by higher spending responses (see filtering note about excluding outliers), with the mean event spend of $54. This figure includes the 16.5% of respondents that reported $0 event spend.
When we report these results at the survey level, the average spend per event is $56, with the median direct event spending being $49. When it comes to estimating the spending of your own event, the median result it the best figure to use, as it represents the most common average spend result from the dataset. It’s worth noting that the interquartile range of this result is $32, which means that the average spend for 50% of all events ranged between $35 – $68.
As a funding partner or event stakeholder, this range can make a huge difference to the overall economic impact of the activities or events you support. Other elements like trip spend, scope and additionality also make a significant difference to the economic impact assessment of events and all deserve a blog post of their own!
If you want to start thinking about the economic impact of your activities, your first step is to start thinking about the spend that your activity is stimulating! If you want to understand the economic impact of your own activities then get in touch.
Analysis Notes
The question dataset was generated from the Culture Counts Australia database, with number or short-text input types and an associate question containing the word ‘spend’. All question texts were manually inspected and any not referring to event spend were removed. Numeric responses were initially filtered to exclude numbers < $0 and > $10,000. For the remaining values, a method of outlier removal called Median Absolute Deviation (MAD) was employed and removed approximately 0.9% of responses. Finally, an additional filter was applied to exclude any survey with less than 20 responses from the dataset.
Image: PrideWA presents Brendan Pang. Credit. Luke Riley Creative.
Culture Counts provides evaluation solutions for measuring impact. Are you interested in our data analysis and reporting solutions? Contact the Client Management team for a friendly chat.
