In the coming weeks, Culture Counts will be simplifying our dimensions statements by hiding the name of the statement in the survey question.
This update is a small but significant change in the way dimensions are presented in the survey interface. This change will make it clear that survey respondents are only responding to the dimension statement itself. Dimension names will remain visible within the platform, allowing users to continue to discuss, interpret and present their dimension results.
Product Director Jordan Gibbs goes into more detail – exploring the reasoning and research behind this change, the testing process and the benefits for both survey respondents and platform users.
Summary
Dimensions are standardised statements used in the Culture Counts Evaluation Platform, designed to help define public value and measure impact.
Culture Counts developed and proposed this original method of collecting standardised feedback about subjective concepts as part of the Public Value Measurement Framework (PVMF) research between 2011 – 2013. This research led to the development of 15 dimension metrics. Since then, we’ve continued to collaborate and develop new dimensions with research partners and our users. There are now over 100 dimension statements in the platform, covering a whole range of outcome areas and activity types, including social and cultural impact, participatory workshops, libraries, museums and placemaking.
The need to build a living evaluation framework; one that responds and bends to the evolving needs of our users, their funding environment, and our shared and evolving concept of ‘value’, means that it is no longer practical to associate a single encapsulating word with an expansive and multilayered concept; whether that be ‘challenge’, ‘distinctiveness’, ‘connection’ or ‘authenticity’.
After reflection, discussion and ongoing research, we have decided to make a change to the way that dimension questions are presented in our survey platform. Starting soon, survey respondents will no longer see the name of the dimension they are responding to – they will only see the dimension statement itself. The name of the dimensions will still remain in the evaluation platform and will still inform the way we discuss dimension results, but will be removed from the statement itself.
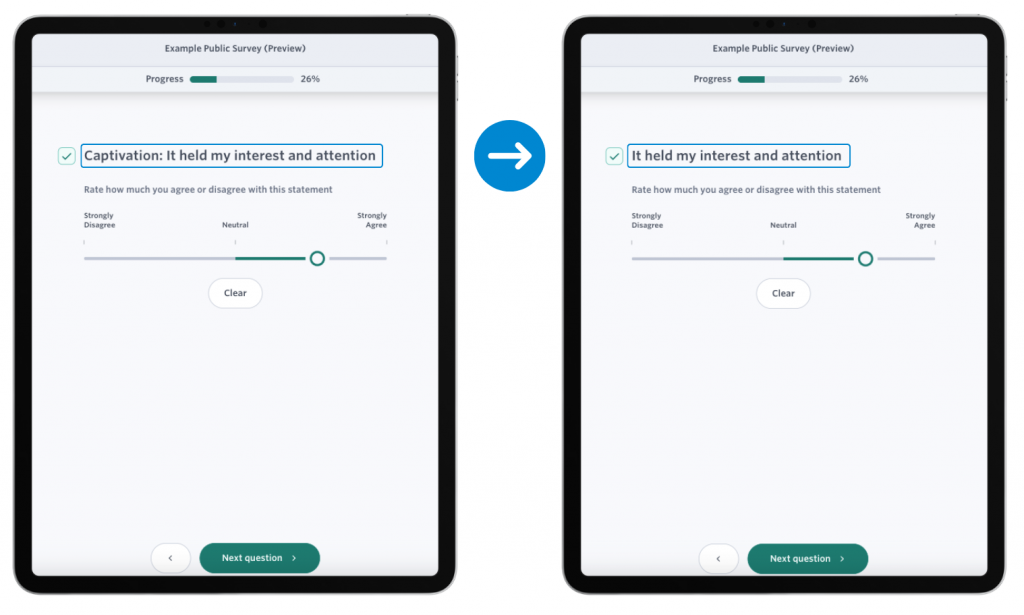
We don’t make this change lightly, but we also believe it is inevitable. This blog will discuss the thinking and research behind this change, but ultimately it should:
- Improve Focus: The focus of measurement will be placed on the statement itself, rather than the combined meaning of the name and statement.
- Improve Definitions: Dimension names can be updated to better reflect the intent of the statement and aid in discussion of the dimension, without having to consider their effect on the data itself.
- Improve Flexibility: New dimensions can be more easily added, without having to worry about conflicts in name-space for existing dimensions.
- Reduce Difficulty for Survey Respondents: Removing the dimension name means there is one less thing for respondents to process. Simplifying the survey experience can increase the chances of the respondent understanding and accurately answering the question, especially if they’re unfamiliar with the dimension’s terminology.
- Minimise Bias: Some dimension names may unintentionally evoke certain biases from respondents based on their personal experiences or perceptions. While we have been careful to develop and test dimensions to avoid this, a focus on the statement’s content further minimises the chances.
- Enhanced Cross-Cultural Use: Dimension names do not always translate well across languages or cultures. Focusing only on the statement makes translating dimensions across languages easier and promotes a universally applicable form of measurement.
💡 Will this mean all previously collected dimension data is no longer valid?
Not at all! In our research we found that respondents gave similar results regardless of whether the dimension name was included or not. This suggests that the dimension name does not play a significant role in determining the response of someone undertaking a Culture Counts survey.
We are confident that for the vast majority of surveys conducted on the Culture Counts platform this change will have no statistically significant effect compared with any data collected previously, nor will it affect the validity of year-on-year comparisons or benchmarking. That being said, we will continue to evaluate and test this change going forward to ensure that this remains the case.
Our Thinking
We believe that removing dimension names from the survey view will simplify the process of measuring them and simultaneously make their meanings clearer to survey respondents. Doing so also reflects feedback that we receive from our users, and strives to increase language accessibility and reduce ambiguity around what is being measured.
The results from A/B testing and factor analysis (read on for detailed findings), give us confidence that the removal of the name will not have any adverse impacts on any data collected in the Culture Counts Evaluation Platform or impact the application of using the big dataset for further research and benchmarking. Indeed, this simplified way to measure dimensions may improve data quality, through ease of understanding and better survey experiences for respondents.
This change also does not affect any other part of the platform. Dimension names will still remain visible to users and all results will be recorded against the dimension names in the CSV and analytics dashboard. The next sections goes into more detail about the testing and decision-making processes that led to this update.
History
A founding idea that inspired the development of dimensions was John Holden’s Capturing Cultural Value paper and his discussion of ‘intangible value’.
“In spite of universally applied accounting standards, practice on accounting for intangibles varies widely. A leading academic in the field, Baruch Lev of New York University, says that ‘for some types of investment in intangibles, financial reports leave us completely in the dark’ and adds that ‘we should create a common language, so that meaningful comparisons of intangible assets can be made”.
John Holden
Dimensions were our attempt to make this practice a reality – to collaboratively create a shared definition of ‘intangibles’ that could speak to the needs to artists, creatives, organisations and their stakeholders. Holden again discusses this concept and the difficulty of measuring value in his followup piece Cultural Value and the Crisis of Legitimacy.
“Institutional value is evidenced in feedback from the public, partners and people working closely with the organisation. Although the idea of public value has come to the attention of policy-makers, ways of measuring and talking about how institutions add value have not yet been fully articulated or brought into everyday practice, except in a small number of institutions”.
John Holden
Holden’s contention that public value was poorly understood in 2006 is notable. While we might argue that in 2023 this is no longer the case, the truth is that many organisations and policy makers still struggle to understand how to measure public value, or to best appreciate the application of ‘collective subjectivity’ that underpins the methodology. Though criticisms of measuring public value are not new (see Price’s 1992 Public Opinion for a detailed guide), ultimately most stakeholders now appreciate asking members of the public about their experience and in believing that this feedback is valuable to collect.
This cultural shift towards the value of measurement (which has only really happened in the last seven years) places us in a completely different context in respect to when our original research was conducted. When we started co-creating dimensions with sector and research colleagues as part of the PVMF in Western Australia, one of our principles of development was to consider the dimension name as part of the question itself. In doing so, we also wanted to avoid repeating the dimension name in the statement. You can see this in one of first statements we developed:
‘Captivation: It was absorbing and held my attention’.
Here, the concept that stakeholders valued was ‘captivation’. This idea of ‘captivation’ is multifaceted and complex. Rather than asking respondents if they were ‘captivated’ (which is vague and open to a wide variety of interpretations), the intuitive solution was to provide a definition for what the term ‘captivation’ means. In this case we defined it as meaning that ‘it was absorbing and held my attention’.
In an operational context where public value was poorly understood and not widely practiced, this was a logical approach. In seeking to demonstrate to stakeholders how intangible values could be measured, the dimension statement itself was the demonstration. Case in point; here we are measuring ‘captivation’ and therefore we are defining it as such.
This idea of not repeating the dimension name in the statement itself was not replicated in the dimension development undertaken by the Manchester cohort. They adopted a ‘blank sheet of paper’ approach to dimension development, focusing primarily on what were the essential features of a high-quality piece of work (Bunting & Knell, 2014). Case in point; ‘presentation’ – a new addition from the Manchester cohort that did not feature in the original PVMF research.
‘Presentation: it was well produced and presented’.
The collaborative and responsive process of dimension development that was shared between the PVMF and Manchester cohorts is how we found ourselves with eight common dimensions that followed the original pattern of not including the dimension name in the statement, but with one dimension that did (i.e. Presentation). Indeed, the inclusion and development of this dimension demonstrated to us that the need to exclude the name from the statement was an artificial one – and that instead the purpose of the dimension statement is to provide a definition of the dimension’s name (and thus the definition would be the focus of a respondent’s attention).
Independent research supported this way of interpreting dimensions. In 2018, Shared Intelligence & the Might Creatives tested a set of the dimensions among a selection of respondent groups to understand their interpretation and accessibility.
“Each metric is made up of a dimension, the specific aspect of a production that is being measured, and a statement, designed to elicit a quantifiable reaction (data) from participants, which will form a comparable dataset. In order to enable the generation of data items that are consistent and comparable, it is therefore crucial that statements are similarly understood by respondents from a variety of age groups, cultures, socio-economic and linguistic backgrounds, whether or not they have a disability or complex needs.”
Shared Intelligence & the Might Creatives
The researchers tested the understanding and interpretation of metrics across four target groups:
- Children and young people
- People with disabilities and other additional or complex needs;
- People for whom English is not their primary language; and
- People living in areas of low socioeconomic status.
The majority of statements were well understood by people in all groups. This came as a surprise to the research team, which took an over-cautious approach to the project, applying detailed scrutiny to each of the metrics to identify where there could possibly be distinct issues or challenges within the statements for the groups.
Shared Intelligence & the Might Creatives
This feedback encouraged us to make the implicit, explicit – that dimensions should be easy-to-understand statements of outcomes or qualities that can be consistently answered by most people. Any rule about what a dimension ‘is’ or ‘is not’ should therefore be in service of that primary goal. In reviewing, adding or updating dimension since, this idea has remained core.
Testing & Research
The discussion regarding the removal of dimension names from the survey has been ongoing for many years. In 2019, we conducted an A/B test to determine if hiding the dimension name would affect on the response data collected. The purpose of this test was to understand firstly if the dimension name influenced on the response and if so, what this effect would be. This would provide context into further discussion about the implications of removing the dimension name from the survey view and help us understand the impact of such a decision.
The test was undertaken at a public event utilising a fieldwork team of Culture Counts staff interviewing event attendees. Interviews were collected during the same period of the event, with staff swapping between the version of the survey they were using in an attempt to eliminate the bias that ‘response time’ could have on the final result. Once a sample of 100 responses were collected for both surveys, the fieldwork team opted to continue collecting responses for the primary survey to complete an independent evaluation of the event.
A (with Name)
B (without name)
There were 9 dimensions asked in each survey.
| Dimension Name | Dimension Statement |
|---|---|
| Diversity | It engaged people from different backgrounds |
| Access | It gave me the opportunity to access activities |
| Community | I feel a sense of community here |
| Presentation | It was well produced and presented |
| Vibrancy | I enjoy the vibrancy and activity here |
| Safety | I feel safe here |
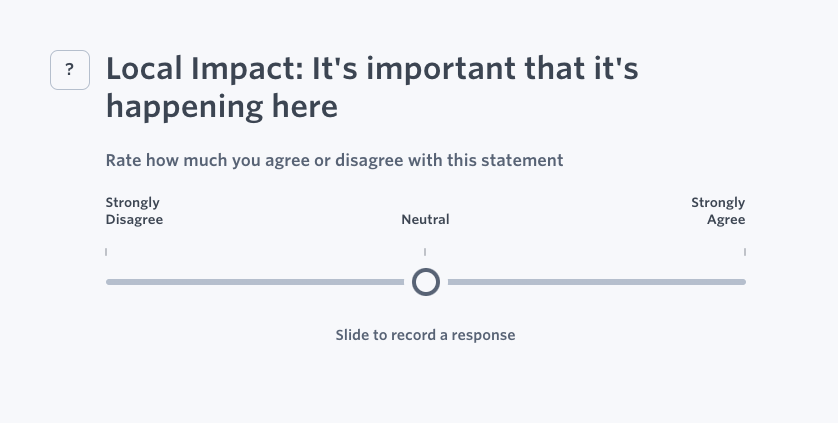
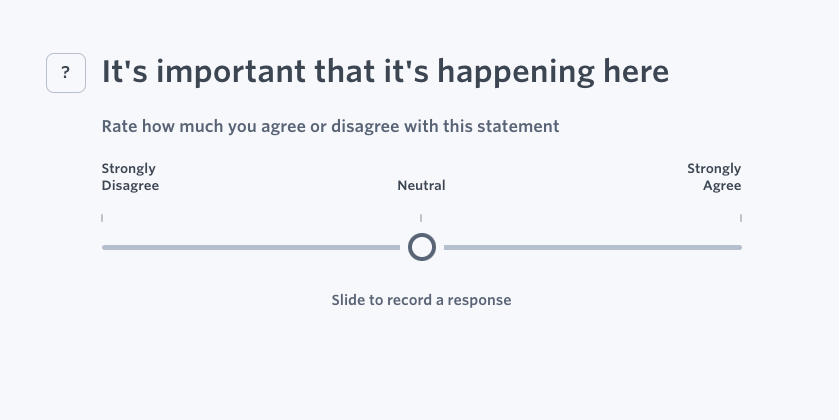
| Local Impact | It’s important that it’s happening here |
| Place | It made me feel proud of my local area |
| Distinctiveness | It was different from things I’ve experienced before |
For each dimension, a Mann-Whitney U-test was run for the comparison of Survey A results and Survey B results.
Note: The dimension data was tested for normality and was found to be non-parametric (mirroring dimension data for most Culture Counts surveys) and as such the non-parametric Mann-Whitney test was selected for use.
The results of the significance test are shown in the following table.
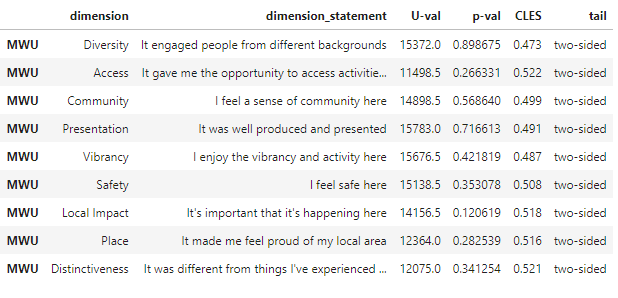
Firstly, every dimension tested reported a p-value > 0.05. A P Value above this threshold typically means we cannot reject the null hypothesis of the test. In this case, the null hypothesis being that the distribution of responses are the same for both Survey A and Survey B. The difference in distribution however does not imply anything of meaning – for that we would be better off looking towards understanding the ‘effect’ (Greenland et. al, 2016).
This means that rather than reviewing response distribution, the type of question we are asking (which is ‘does removing the name affect the results’) suggests that ‘significance’ should be determined by how likely this change is to affect the reported overall result (that being the level of agreement for each dimension – otherwise referred to as the ‘score’).
To help answer that question, we utilise the Common Language Effect Size (CLES) from McGraw & Wong (1992). The CLES is “the probability that a randomly selected sample from one population will be greater than a randomly selected sample from the other population”. Using this test we see values of ~0.5, which indicate that there is almost no effect between the two sample set. This means that a randomly drawn sample from one survey is equally likely to be higher or lower than a randomly drawn sample from the other survey.
Another statistical approach which can be considered when evaluating multidimensional data is factor analysis. Factor analysis can be used to understand the underlying structure across a range of variables to help reveal which factors are responsible for the greatest effects within a dataset. We undertook a factors analysis approach in 2020, selecting 24 dimensions that were utilised across 263 audience surveys of events (DLGSC, 2020).
Five factors were investigated in this dataset:
- Artform type (Performing, Visual, Combined, Participatory)
- Event (Survey Name)
- Gender (Male, Female, In Another Way)
- Age Group (< 20, 20-29, 30-39, 40-49, 50–59, 60–69, => 70)
- Location of origin of respondent – by Postcode (Perth Metro, Rest of WA, Interstate)
For each factor, a one-way ANOVA was performed with:
- Dependent variable (DV): Dimension response
- Independent variable (IV): Factor
This meant that there were 24 dependent variables and 5 factors. Of the 120 tests conducted, 17 produced a Partial eta-square effect size of > 0.06, or what could otherwise we considered a ‘medium or large effect’. The only factor responsible for this effect size was seen to be survey name, or i.e. the event being evaluated.
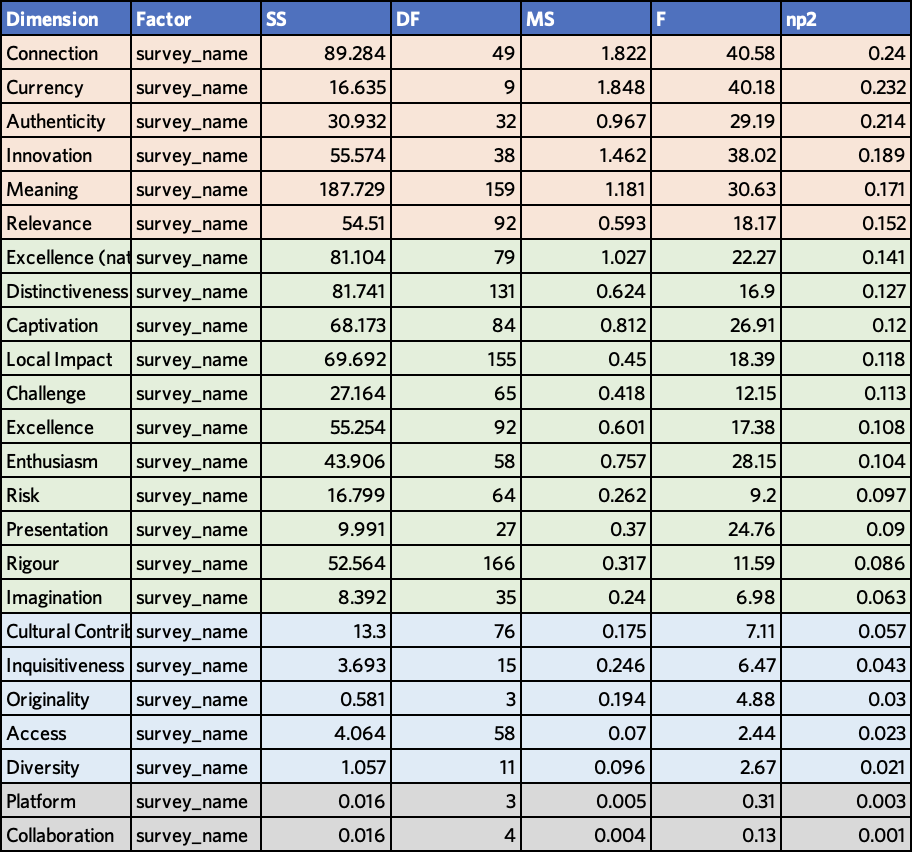
In fact, only two dimensions did not produce a significant effect size (i.e. > 0.02) in regards to survey name, those being Platform and Collaboration. The fact that these dimensions were only tested across 3 or 4 events respectively may also be a relevant factor in this result.
What this suggests is that the activity being evaluated is the factor which is most likely to have the largest effect on the results being captured. Indeed, any effort put into understanding the factors and effects of public value or sentiment would appear to be better spent in this area, rather than in understanding the effects of ‘dimension name’ on the results collected.
Talk to us
If you have questions or concerns, please be sure to contact us – we would love to understand what those concerns are and if we can address them in any way. We believe that this change will make the platform and methodology better – but want to progress in a way that is collaborative and true to the spirit of the research that got us here.
If you would like to get in touch, please reach out to your client manager, or contact us via our website.
Bunting, B. and Knell, J. 2014. ‘Measuring quality in the cultural sector’. Arts Council England.
Culture Counts, 2020. Evaluation snapshot: culture and the arts 2016-19. Department of Local Government, Sport and Cultural Industries. Access.
Greenland, S., Senn, S.J., Rothman, K.J., Carlin, J.B., Poole, C., Goodman, S.N. and Altman, D.G., 2016. ‘Statistical tests, P values, confidence intervals, and power: a guide to misinterpretations’. European journal of epidemiology, 31, pp.337-350.
Holden, J., 2006. ‘Capturing Cultural Value’. Demos. pp. 39-41. Access.
Holden, J. 2006. ‘Cultural Value and the Crisis of Legitimacy’. Demos. pp. 18. Access.
Lev, B., 2003. ‘Remarks on the measurement, valuation, and reporting of intangible assets’. Federal Reserve Bank of New York, issue Sep, pages 17-22. Access.
Price, V., 1992. Public opinion (Vol. 4). Sage.
Price, V. 2011. ‘Public Opinion Research in the New Century: Reflections of a Former POQ Editor’, Public Opinion Quarterly, Volume 75, Issue 5, pp. 846–853. Access.
McGraw, K.O. and Wong, S.P., 1992. ‘A common language effect size statistic’. Psychological bulletin, 111(2), p.361. Access.