In June 2022, we launched our Question Bank feature, allowing users to include standardised question types within their evaluation and surveys. In that short time, users have collected over 26,000 responses with the feature. Business Development Director, Jordan Gibbs, investigates the most popular questions so far, for users and respondents alike.
Overview
The Question Bank looks to categorise typical or common questions that users want to include in their surveys. These include the standard demographic and overall experience questions, along with new questions and categories like ‘Identity’, ‘Behaviour’ and ‘Tourism’. You can read more about the background of the feature here.

This feature has been live for three months, which is small when compared to the complete life of the Culture Counts database. In this short time, we thought it would be interesting to see which question is rising to the top. Ranking by the number of responses collected, the new ‘Identity’ question appears to be the most popular – “Do you identify with any of the following?”. The question aggregates a range of specific identities that respondents can select from.
A list of the top 11 questions, when ranked by the number of responses collected, is presented in the following graph.
Top 11 Questions (Sep 2022)
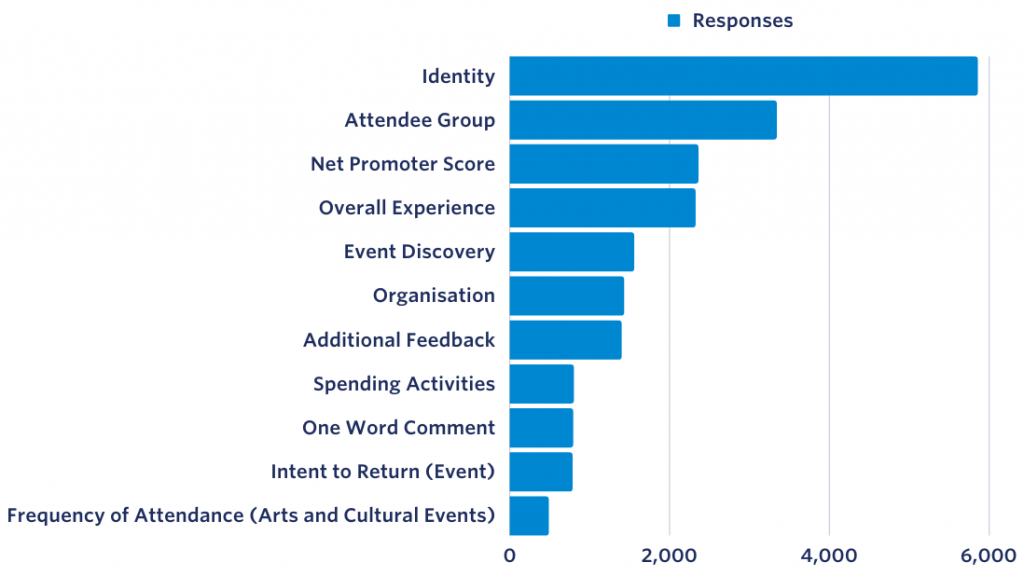
Even at this early stage, it appears the results in the graph are beginning to reflect a ‘power law distribution’. Power laws are a shockingly common statistical phenomenon. The one we see here is generally referred to as a ‘long-tail’, which in a nutshell, reflects results that are concentrated in a few areas and widely spread over many others. You are likely to see other types of ‘long-tail’ distributions in your own organisation, programming or audience trends.
Most popular questions
There are 27 questions available to all users within the Question Bank. Over the past three months, users have collected over 26,000 responses to these questions, of which 41% (i.e. 11 questions) have collected over 500 responses each.
When choosing to rank the popularity of questions, we have two options; we can rank by the number of responses collected (as shown in the chart above) or the number of surveys the question is included in (as shown in the table below). So which is the most appropriate option to determine question popularity?
When we rank by the number of responses, we potentially bias ourselves toward large events or activities. Is a question truly popular if it is only contained across a limited number of surveys that just happen to have a large number of responses?
To avoid this potential bias, when looking at the most popular questions, we can also reference the number of surveys the question is included in. This is shown in the following table. Returning to the ‘Identity’ question – what’s interesting is that this has the highest number of responses and has been included in the greatest number of surveys. This means, hands down, that ‘Identity’ is currently the most popular question in the Question Bank.
| Responses (qty) | Surveys (qty) | Question/Metric | Category | Question Text |
|---|---|---|---|---|
| 5,854 | 89 | Identity | Demographics | Do you identify with any of the following? |
| 3,338 | 12 | Attendee Group | Patron Behaviour | Which of the following best describes who you attended the event with? |
| 2,357 | 34 | Net Promoter Score | Experience | How likely is it that you would recommend this event to a friend or colleague? |
| 2,321 | 33 | Overall Experience | Experience | How would you rate your experience overall? |
| 1,522 | 17 | Event Discovery | Marketing | How did you hear about this event? |
| 1,426 | 17 | Organisation | First Time | Is this your first time engaging with this organisation? |
| 1,395 | 75 | Additional Feedback | Qualitative Feedback | Please add any other comments or feedback about the event below. |
| 797 | 8 | Spending Activities | Tourism | Did you spend money on any of the following activities, before or after attending the event? |
| 789 | 25 | One Word Comment | Qualitative Feedback | What one word best describes your experience? |
| 781 | 15 | Intent to Return (Event) | Experience | How likely are you to attend the event again? |
| 483 | 9 | Frequency of Attendance (Arts and Cultural Events) | Patron Behaviour | Approximately, how frequently have you attended arts and cultural events in the past 12 months? |
Deep dive
There are some other interesting insights to be gleaned from this data too, even at this early stage.
‘Attendee Group’ has collected the second highest number of responses in the short time since launch, but compared to ‘Identity’, the question has only been used across 12 surveys. That could imply the increased relevance or need for this question for larger activities or events.
‘Overall Experience’ and ‘Net Promoter Score’ remain popular questions, but this is to be expected, given that these questions were previously available in the Culture Counts Evaluation Platform under a different category. This is good to note, as the analysis provided above only represents data collected through Question Bank questions. So if surveys created prior to the Question Bank launch were using the old version of the ‘Overall Experience’ question (for example), that data is excluded from the ranking. Essentially that means that the above results are from users that have deliberately gone into the Question Bank to add these questions to their surveys, whether they be existing surveys or new ones.
For those that have used the feature, you’ll know that we have flexible fields within the question text. So for questions like ‘Event Discovery’, even though the question text reads “How did you hear about this event?’” the actuality of the question is more like “How did you hear about this xx?” – because users can replace the word ‘event’ with any word they like. That’s one of the great powers of the Question Bank. Even though the question text can change, we can still group and aggregate the underlying data based on the Name or ID of the question, rather than relying simply on the question text. You only need to look at our research from 2021 to see why this simplicity and ease of analysis is a huge upgrade from where we were last year.
Finally, the use of the ‘Frequency of Attendance’ question is particularly intriguing. Even though the question has only been used in 9 surveys, we spent considerable time designing a ‘Frequency of Use’ question that aligns with the broader arts engagement research out there. In the Australia Council’s Audience Data and Advocacy Tools from Lonergan, ‘Active Engagement’ was one of three major components in its suggested segmentation model. Giving organisations a mechanism to engage with research like this and to understand how their audience compares to that of national trends offers potential for a massive unlock in terms of programming relevance and marketing insight. It’s something we are deeply passionate about and are actively looking at.
Understanding how this question has been taken up so far by users is uniquely interesting in continuing to deliver on that mission. We’re excited to see how the Question Bank grows and evolves into the future. If you have any ideas or feedback, please let us know at hello@culturecounts.cc.
References:
Australia Council, 2021. ‘Audience Data and Advocacy Tools’. Australia Council for the Arts. Accessed 21 September 2022.
Indig, K. 2019. ‘Power Laws and the Pareto Principle – Powerful Ideas’. Kevin-Indig.com. Accessed 21 September 2022.
McKenzie, T. 2021. ‘Top six custom questions of 2021’. Culture Counts. Accessed 21 September 2022.