In June, we introduced new chart types and filters within the Analytics Dashboard of the Culture Counts Evaluation Platform.
The streamlined dashboard includes new chart types and allows users to compare and filter their data in each chart – providing opportunities for deeper data analysis. We have also tweaked the layout and style of the dashboard, adding a variety of colours as well as making the charts easier to read and understand.
We’ve been building to this release for over three years, iterating and testing different chart types, designs and formats to come up with a streamlined dashboard that speaks to a variety of use cases and scenarios. Read on for more information about the dashboard, comparison presets, and its structure.
Upgrades to charts
We’ve built a new charting technology called ‘Chart Units’. Chart Units deliver a variety of upgrades and enhancements compared to our previous chart technology, including:
- New looks and styles for all chart types
- Optimised scaling of charts for web browsers
- Integrated response counts
- Save functionality
- Free text responses that can be viewed directly in the dashboard
Presets for comparisons and customisations
We’ve added a new customisation panel to charts, as well as a set of quick-access comparisons. Charts can be quickly filtered with some standard presets if your evaluation includes questions from our Question Bank.
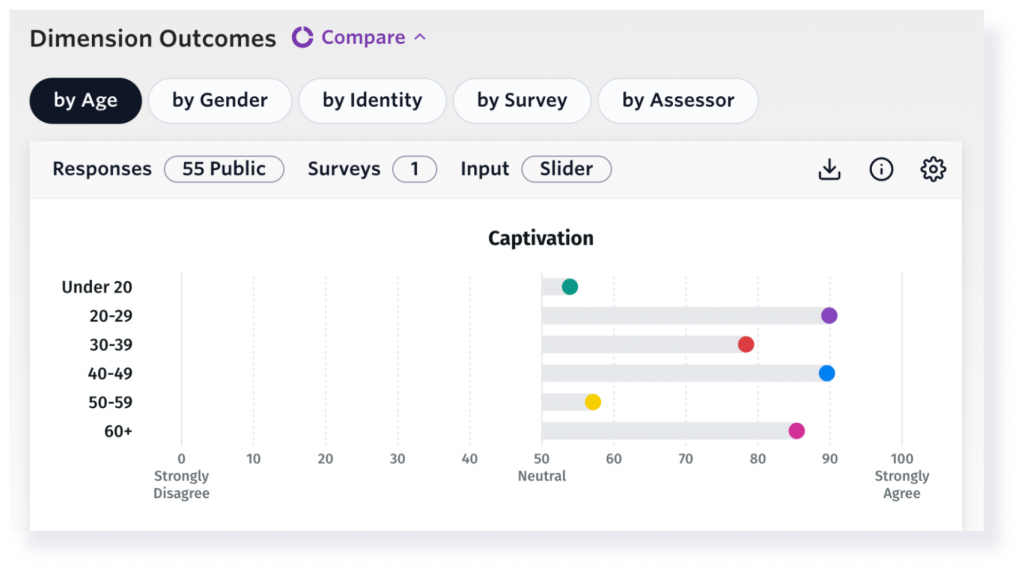
We are launching with our most-requested comparisons, with plans to add more based on user feedback including:
- By Age: responses to questions can be broken down by the age group of the respondents
- By Gender: provides a breakdown of the responses based on the respondent’s gender identity
- By Identity: breaks down responses by respondent identity. E.G. Born overseas, LGBTQIA+, Aboriginal and/or Torres Strait Islander (only available in Australia)
- By Survey: allows comparison for results collected for each survey
- By Assessor: allows comparison of results collected by public, self, and peer assessors
For users in the United Kingdom, we have the following additional options:
- Sexual Orientation: results by respondent’s description of sexual orientation (only available in the UK)
- D/deaf or Disability: results by respondent D/deaf or Disability identity (only available in the UK)
Some comparisons are only available in certain regions, based on whether that question is standardised globally or has unique choices available to that region. We expect to add new comparison options after launch.
For those who want some additional flexibility, we have an advanced settings panel for each chart. Here you can change the chart type, sort the order and filter responses – with all settings adapting to the type of data you are reviewing.
Streamlined structure
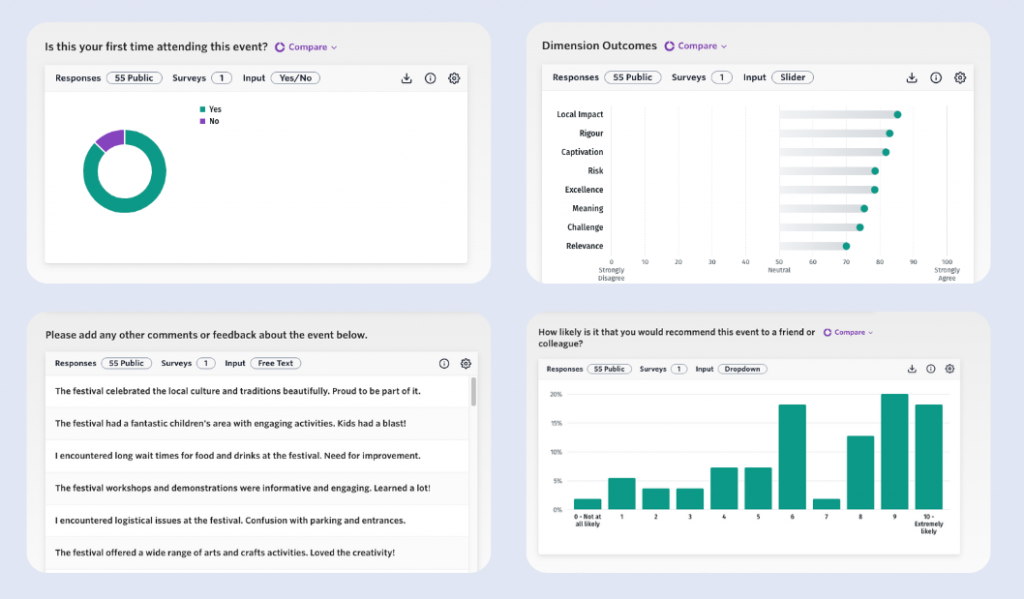
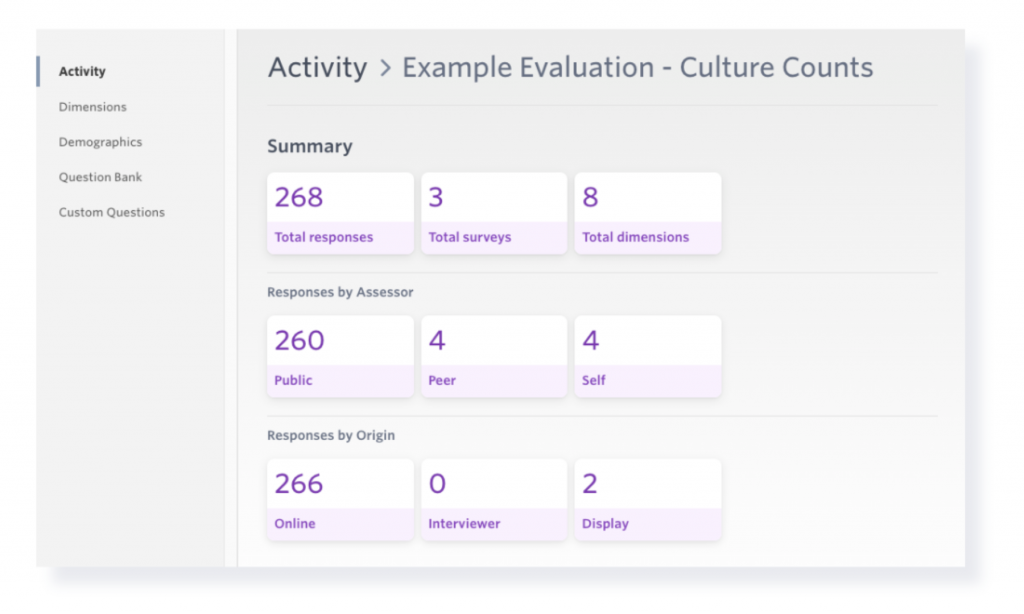
We’ve simplified the way data is structured in the analytics dashboard to make exploration more intuitive. There are now five question categories, including a new Activity page that provides a quick overview of your data:
- Activity: see how evaluations are tracking with a live summary of response counts, surveys and dimensions
- Dimensions: gain easy access to dimension results and essential statistics, including margin of error
- Demographics: view charts for common demographic Age, Gender, Postcode, and Identity questions
- Question Bank: find results from our library of standardised questions including experience, net promoter score and first-time attendance
- Custom questions: view the data from your own questions
We hope that new chart types and filters will make it easier for users to access, view, analyse, and compare their data. Users can export charts that reflect configured settings or save those settings for the next time they log in to the platform.
If you have any questions or feedback about the new charts, please reach out to the Client Team or contact us here.